
Bull Flag and Bear Flag Patterns: How to Trade Them
Learn to spot a bull flag pattern and a bear flag pattern, where traders set entries, stops, and targets, and why flags fail. Plain examples, no hype.
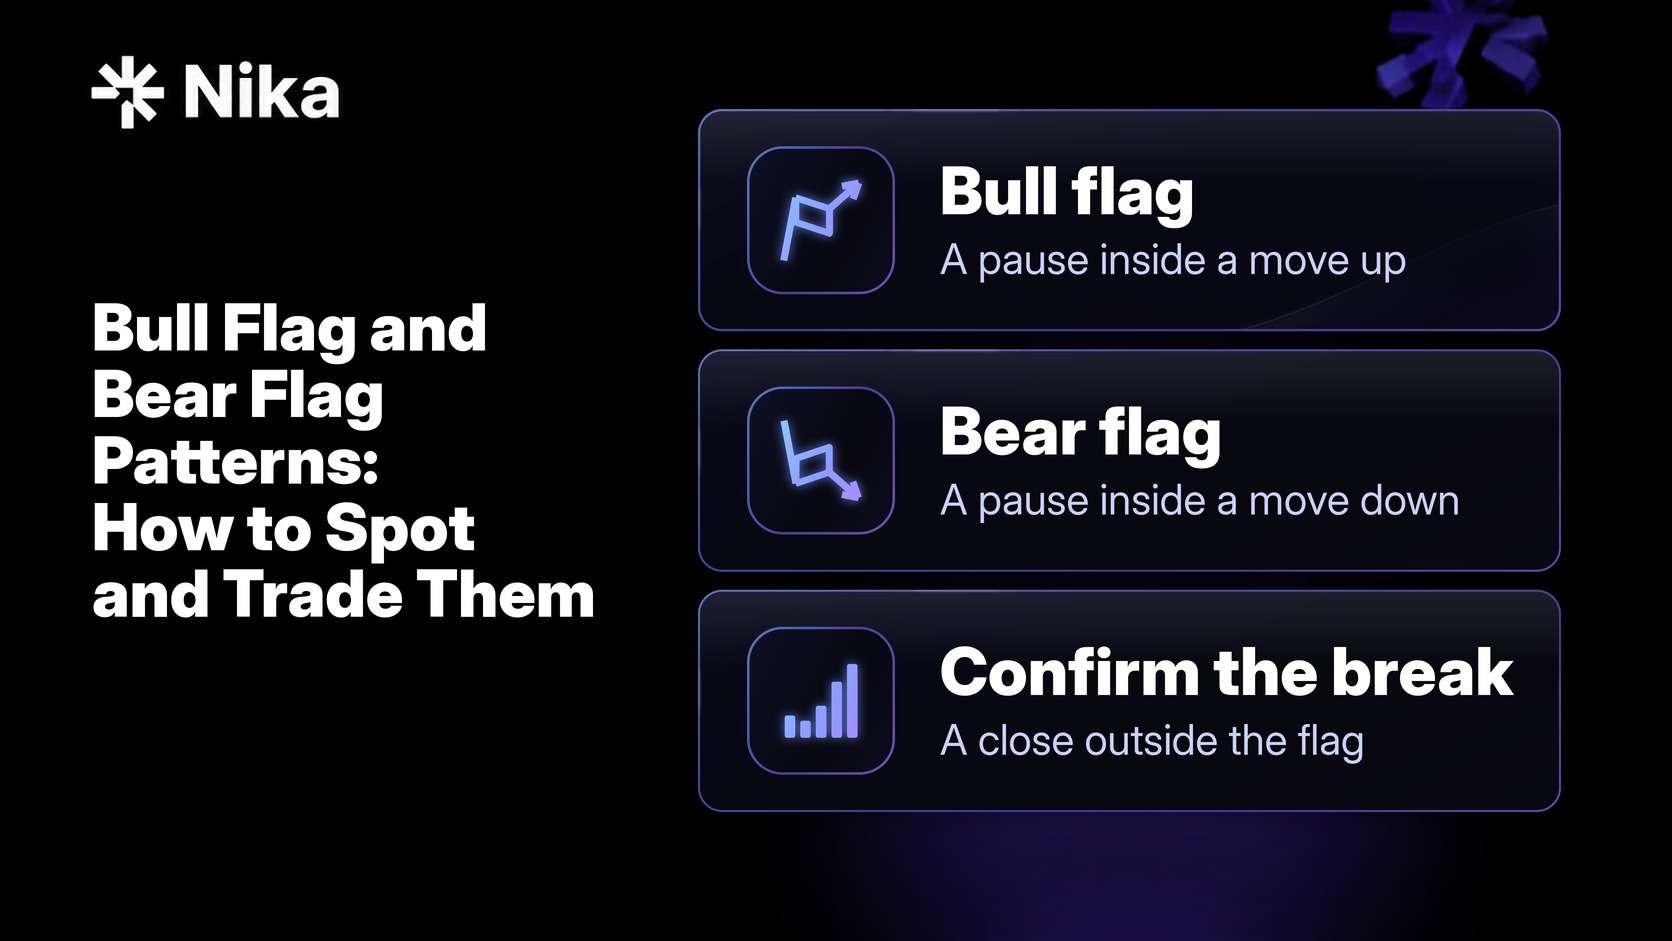
A bull flag pattern is a short pause inside a strong move up that can resolve with another move up. A bear flag pattern is the mirror image: a short pause inside a strong move down that can resolve lower.
Both are continuation patterns, which means they describe a trend taking a breather. A pattern describes what price has already done. It is not a promise of what price will do next.
Disclosure: This guide is published by Nika, an app where you can trade crypto, stocks, commodities, and forex, including Hyperliquid perpetuals. It explains standard technical analysis and is not trading advice.
The short answer
A flag pattern has two parts: a flagpole, which is a fast, steep price move, and a flag, which is a brief, orderly drift against that move inside two roughly parallel lines. A bull flag forms after a sharp rise and breaks upward. A bear flag forms after a sharp drop and breaks downward.
- Bull flag: a continuation pattern after a sharp rise. The flag drifts sideways or slightly down.
- Bear flag: a continuation pattern after a sharp drop. The flag drifts sideways or slightly up.
- Confirmation: a candle closes outside the flag in the direction of the pole, ideally on rising volume.
What a bull flag pattern looks like
The flagpole
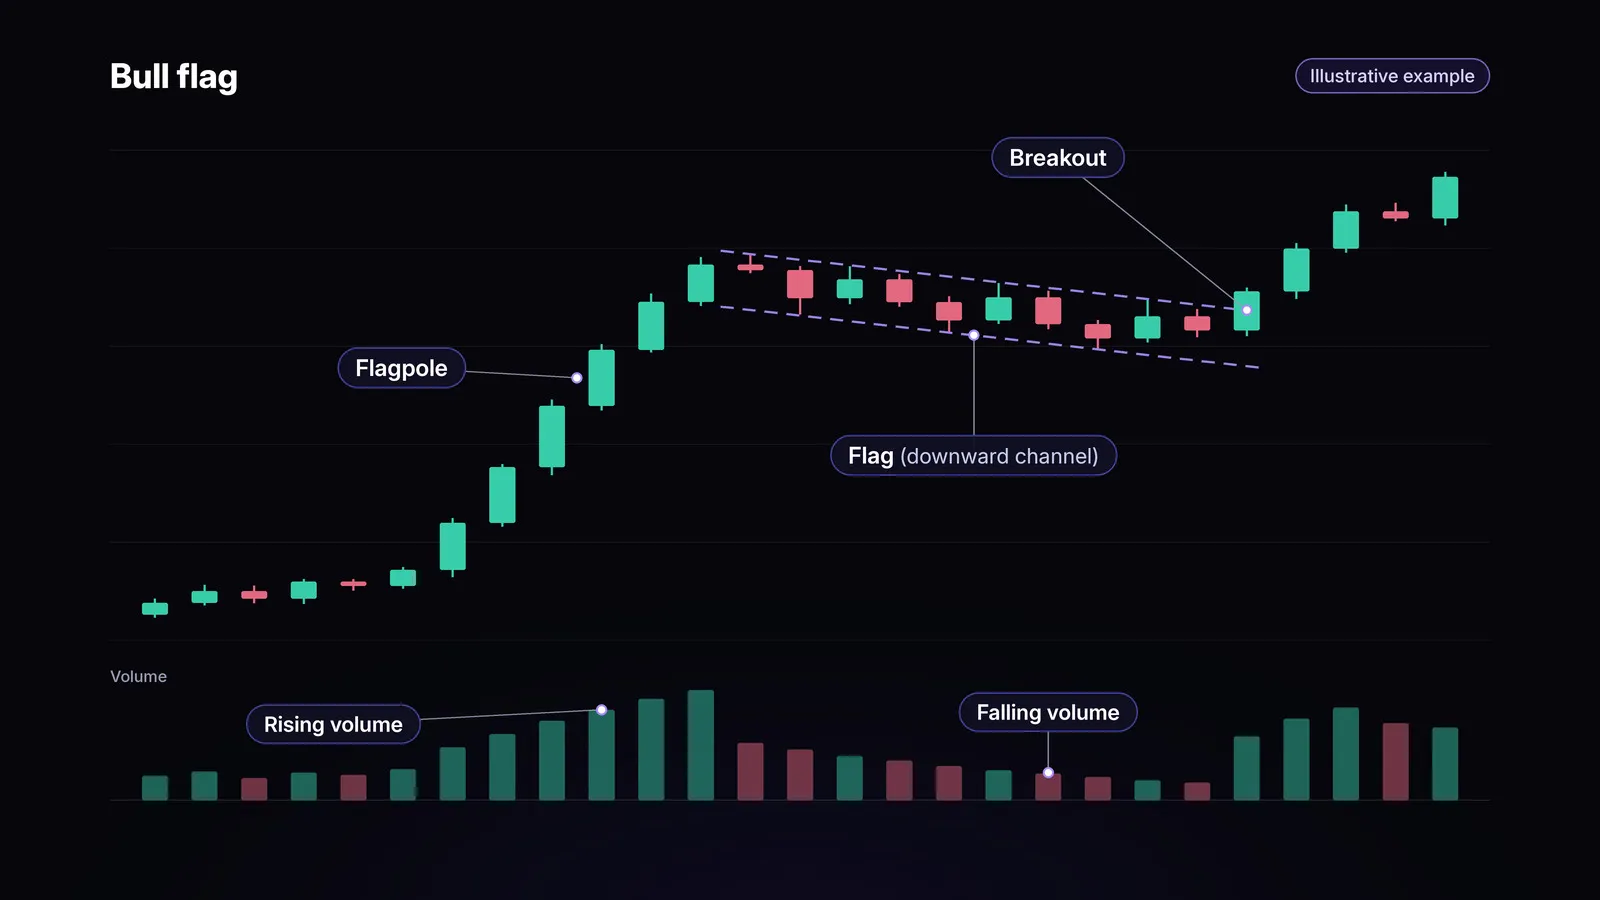
The pole is a fast, near-vertical rise, often on above-average volume. It usually covers a lot of ground in a few candles. A slow, grinding climb does not make a good pole, because the pattern depends on a burst of buying that then pauses.
The flag
After the pole, price drifts in a short, orderly pullback or moves sideways. You can draw two roughly parallel trendlines around this drift, one along the highs and one along the lows. In a bull flag, those lines slope slightly down or run flat.
A common rule of thumb is that the flag should retrace less than half of the pole (OANDA). A deeper pullback suggests sellers are stronger than a simple pause would imply. The flag should also be short compared with the pole.
Volume
Volume is usually heavy on the pole, lighter in the flag, and rising again on the breakout (StockCharts ChartSchool, OANDA). Light volume in the flag suggests the pullback is profit-taking, not a wave of new selling.
Treat volume as supporting evidence, not proof. It also reads differently by market. Crypto trades around the clock, so volume shifts with time zones and weekends. Spot forex has no single central exchange (BIS), so many forex charts show tick volume, a count of price updates, rather than the size actually traded.
To check whether a pause sits inside a larger move, look at the same market on a longer timeframe, for example Bitcoin on Nika.
What a bear flag pattern looks like
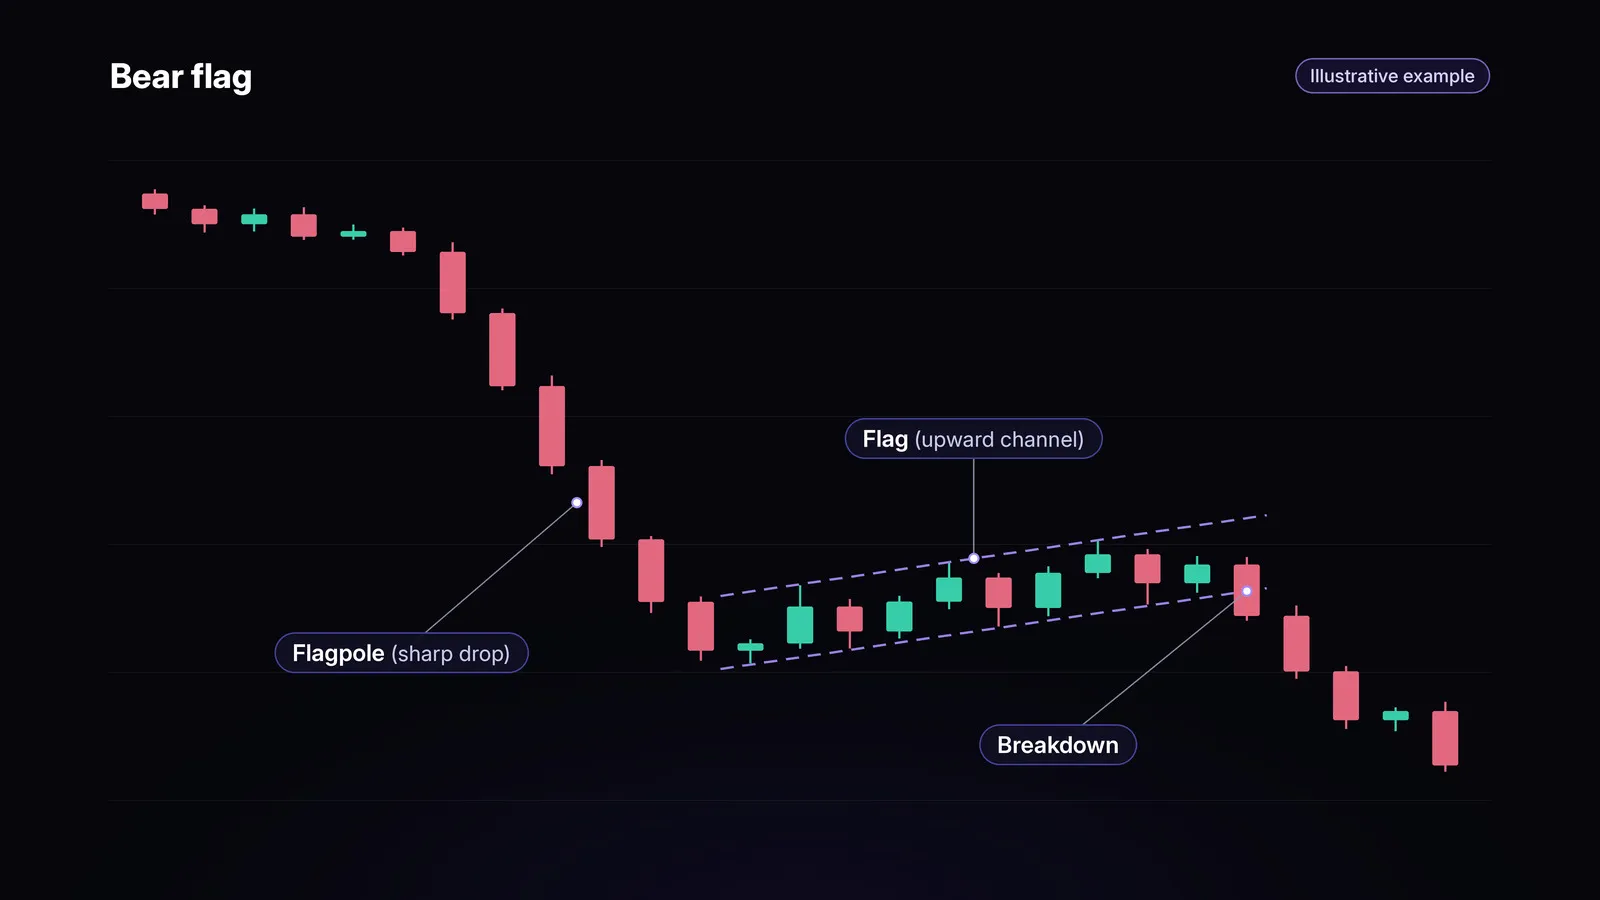
A bear flag flips every part of the bull flag. The pole is a sharp drop, often on heavy volume. The flag is a weak bounce or a sideways drift inside a channel that runs flat or slopes slightly up. The pattern confirms when a candle closes below the lower trendline of the flag.
The bounce tends to be hesitant, and volume usually stays light. Charles Schwab notes that a bear flag typically takes five days to three weeks to form (Charles Schwab).
A bear flag is a setup some traders use to go short. On Nika, you can take a short position with perpetual futures on Hyperliquid, and Nika provides access to 500+ markets, including crypto, stocks, commodities, and forex. If you are new to perps, this explains how perpetual futures on a perp DEX work.
Bull flag vs bear flag
| Bull flag | Bear flag | |
|---|---|---|
| Trend before the flag | Sharp rise | Sharp drop |
| Flag slope | Flat or slightly down | Flat or slightly up |
| Breakout direction | Up, through the upper trendline | Down, through the lower trendline |
| Where the stop usually goes | Below the flag low | Above the flag high |
How traders confirm a flag breakout
A flag is only a possible setup until price leaves it. Most traders look for several signs together.
- A candle close beyond the trendline. A wick that pokes outside the flag and closes back inside does not count.
- Volume picking up on the break. A breakout on rising volume suggests real participation. A breakout on thin volume is easier to reverse.
- A higher timeframe that agrees. A bull flag on a 15-minute chart carries more weight when the daily trend is also up. Many traders treat a flag that runs against the larger trend as more likely to fail.
- An optional retest. After a breakout, price sometimes comes back to touch the broken trendline before moving on. Waiting for a retest can give a tighter stop and a clearer signal. The tradeoff is that strong moves often never come back, so you miss them.
The more of these line up, the clearer the setup, but none of them guarantees follow-through.
Entries, stops, and targets
Decide three prices before you enter: where you get in, where you admit you were wrong, and where you plan to take profit.
Entry
The most common entry is on the breakout close, when a candle closes outside the flag. A more patient entry waits for the retest of the broken trendline. Some traders place a stop or limit order just beyond the flag boundary so the order triggers only if price breaks out, rather than watching the screen for the moment.
Stop-loss
For a bull flag, the usual stop sits below the flag low. For a bear flag, it sits above the flag high. If price returns there, the pattern has failed.
A stop is a trigger, not a guaranteed price. In a fast move or a gap, a stop order can fill late or at a worse price than the level you set.
Measured-move target
The common convention for a target is the measured move: take the length of the pole and project it from the breakout point. For a bull flag, add it. For a bear flag, subtract it. Treat the result as a rough reference, not a destination. Price can stop short of the measured-move target or run past it (CMC Markets), and some traders take partial profit earlier.
Worked example
The numbers below are hypothetical round numbers for illustration, not a real chart or a forecast.
| Step | Bull flag | Bear flag |
|---|---|---|
| Pole | 100 to 120 (20 points) | 200 to 170 (30 points) |
| Flag | Drifts down to 116 | Bounces to 176 |
| Breakout or breakdown close | 118 | 173 |
| Stop | 115, below the flag low | 177, above the flag high |
| Measured-move target | 138 (118 plus 20) | 143 (173 minus 30) |
| Risk per unit | 3 (118 minus 115) | 4 (177 minus 173) |
| Potential reward per unit | 20 | 30 |
In the bull flag example, the trader risks 3 points to aim for 20, a reward-to-risk ratio of about 6.7 to 1. In the bear flag example, the ratio is 7.5 to 1. A good ratio says nothing about how likely the target is. The example excludes fees, spread, slippage, and funding on perps, all of which reduce the result.
If you trade a flag with leverage, check where your liquidation price sits compared with your stop. The stop should trigger well before liquidation does. The Nika app shows an estimated liquidation price before you confirm a perp trade, and this guide explains how a Hyperliquid liquidation price is calculated.
Why flag patterns fail
Flags fail often, and in a few common ways.
- False breakouts. Price closes outside the flag, then reverses straight back in.
- Deep flags. A flag that retraces more than half the pole is a weaker signal.
- Flags that drag on. A flag that lasts much longer than the pole tends to turn into a sideways range, and the momentum that made the pole fades.
- News and macro events. An earnings report, an inflation print, or a central bank decision can overwhelm any pattern in seconds.
- Thin liquidity. In small markets, a few orders can push price through a trendline and back.
- Noisy low timeframes. On one-minute and five-minute charts, flag shapes appear constantly, and many are random noise.
There is no fixed success rate for flag patterns. Results depend on the market, the timeframe, and the exact rules used to define the pattern and the trade. No chart pattern guarantees an outcome.
Flags across markets: crypto, stocks, gold, and forex
The same shape appears in any liquid market, but each market adds its own quirks.
- Crypto trades 24/7, so there are no overnight gaps on most charts. It does produce sharp wicks, and a wick through a flag boundary can trigger stops before price settles back.
- Stocks close overnight and can gap at the open. A bull flag can break out on a gap, which makes the entry price hard to control, and a gap through your stop can fill well past it.
- Gold and oil react to macro data such as inflation reports, interest rate decisions, and supply news. A flag that forms ahead of a scheduled release can resolve in either direction when the number comes out.
- Forex pairs move on central bank news and economic data, and their charts often show tick volume rather than traded size, so the volume clue is weaker.
On Nika, you can watch these patterns form across crypto, stocks, commodities, and forex from one app, on markets such as Ethereum, Nvidia, gold, and EUR/USD.
Flags vs pennants and other continuation patterns
Several continuation patterns look alike. The difference is usually the shape of the pause.
- Pennant: a pole followed by a small, symmetrical triangle with converging trendlines. A flag has parallel trendlines. Traders treat the two in a similar way.
- Rectangle: a longer sideways range with flat highs and lows. It can follow any trend, and it does not need a sharp pole first.
- Ascending triangle: a flat resistance line with rising lows underneath. It shows buyers pressing against one level, rather than a pullback after a burst.
- Cup and handle: a slower, rounded base that recovers to the old high, followed by a small pullback. Flags take days or weeks on a daily chart, while a cup and handle usually takes much longer. If you want the slower version, read about the cup and handle pattern.
Managing risk when you trade flags with leverage
Chart patterns fail often, and leverage magnifies losses as well as gains.
- Size from the stop. Decide how much of the account you can lose on one failed flag, then size the position so that hitting the stop costs about that amount. Many traders keep this to a small, fixed share of the account.
- Leverage changes size, not odds. It does not make the flag more likely to work, and it moves your liquidation price closer to your entry.
- Holding costs add up. Perpetual futures charge or pay funding while the position is open. A flag that takes days to reach its target can cost more in funding than you planned.
For a fuller picture, read about the risks of trading with leverage.
On Nika, perps offer leverage of up to 50x, with isolated or cross margin, depending on the market. In isolated margin, a liquidation affects only that position and its margin, which limits what one failed flag can take from the rest of your account. Our guide to isolated or cross margin on Nika perps covers the difference.
Frequently asked questions
What does a bull flag pattern mean?
A bull flag means a strong rise has paused in a short, orderly pullback. Traders read it as a possible continuation of the rise if price closes above the flag, but the pattern can fail.
How accurate is a bull flag?
There is no fixed accuracy or success rate. Results depend on the market, the timeframe, volume, and the rules used to define the pattern, and flags fail often, so a stop and position sizing matter more than any single pattern.
Is a bear flag bullish or bearish?
A bear flag is bearish. It forms after a sharp drop and signals a possible continuation lower if price closes below the flag.
How long does a flag pattern take to form?
A flag is usually short compared with its pole. On daily charts that often means a few days to a few weeks, and on intraday charts it can mean minutes to hours.
What is the price target of a flag pattern?
The common convention is the measured move: the length of the pole projected from the breakout point. It is a rough reference, and price often stops short of it or runs past it.
Can I trade bull and bear flags on Nika?
Yes. Nika provides access to 500+ markets, including crypto, stocks, commodities, and forex, and its Hyperliquid perps let you go long or short. Spotting the pattern and deciding whether to trade it is up to you.
Sources
- Charles Schwab, 3 Bearish Patterns in Trading
- CMC Markets, Bear flag pattern explained
- OANDA, Master chart patterns: Learn how to trade the bull and bear flag pattern
- StockCharts ChartSchool, Flag, Pennant
- Bank for International Settlements, Dealer-customer and inter-dealer trading in a fragmented spot market
Sources checked on 30 October 2026.
Explore Nika
Spot the pattern and trade it across 500+ markets in one self-custodial app.
Open Nika to trade crypto, stocks, commodities, and forex, including Hyperliquid perps that let you go long or short. Gas fees are covered automatically in the Nika app. Nika is self-custodial: Privy provides the wallet infrastructure, and Nika doesn’t hold users’ private keys. You can explore 500+ markets on Nika, or get the Nika app on iPhone and Android.
Access to perpetuals and prediction markets is subject to the underlying protocols’ terms and availability.
