
Cup and Handle Pattern: How to Spot and Trade It
The cup and handle pattern is a bullish continuation setup. Learn its shape, where the breakout and stop sit, how to set a target, and why it fails.
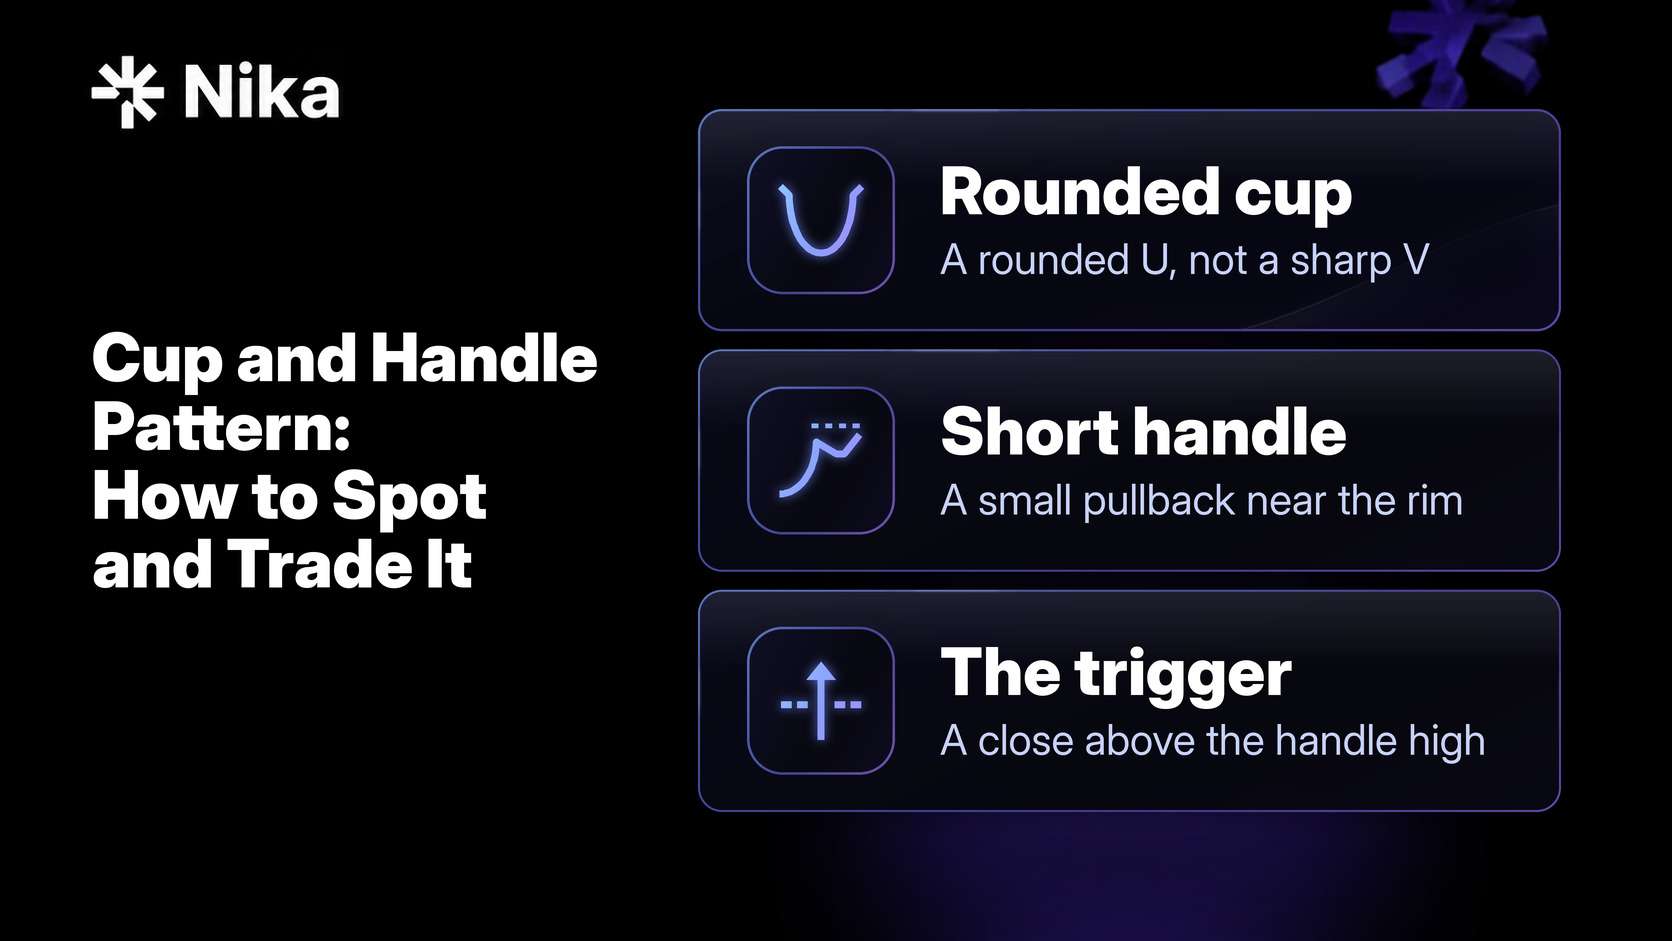
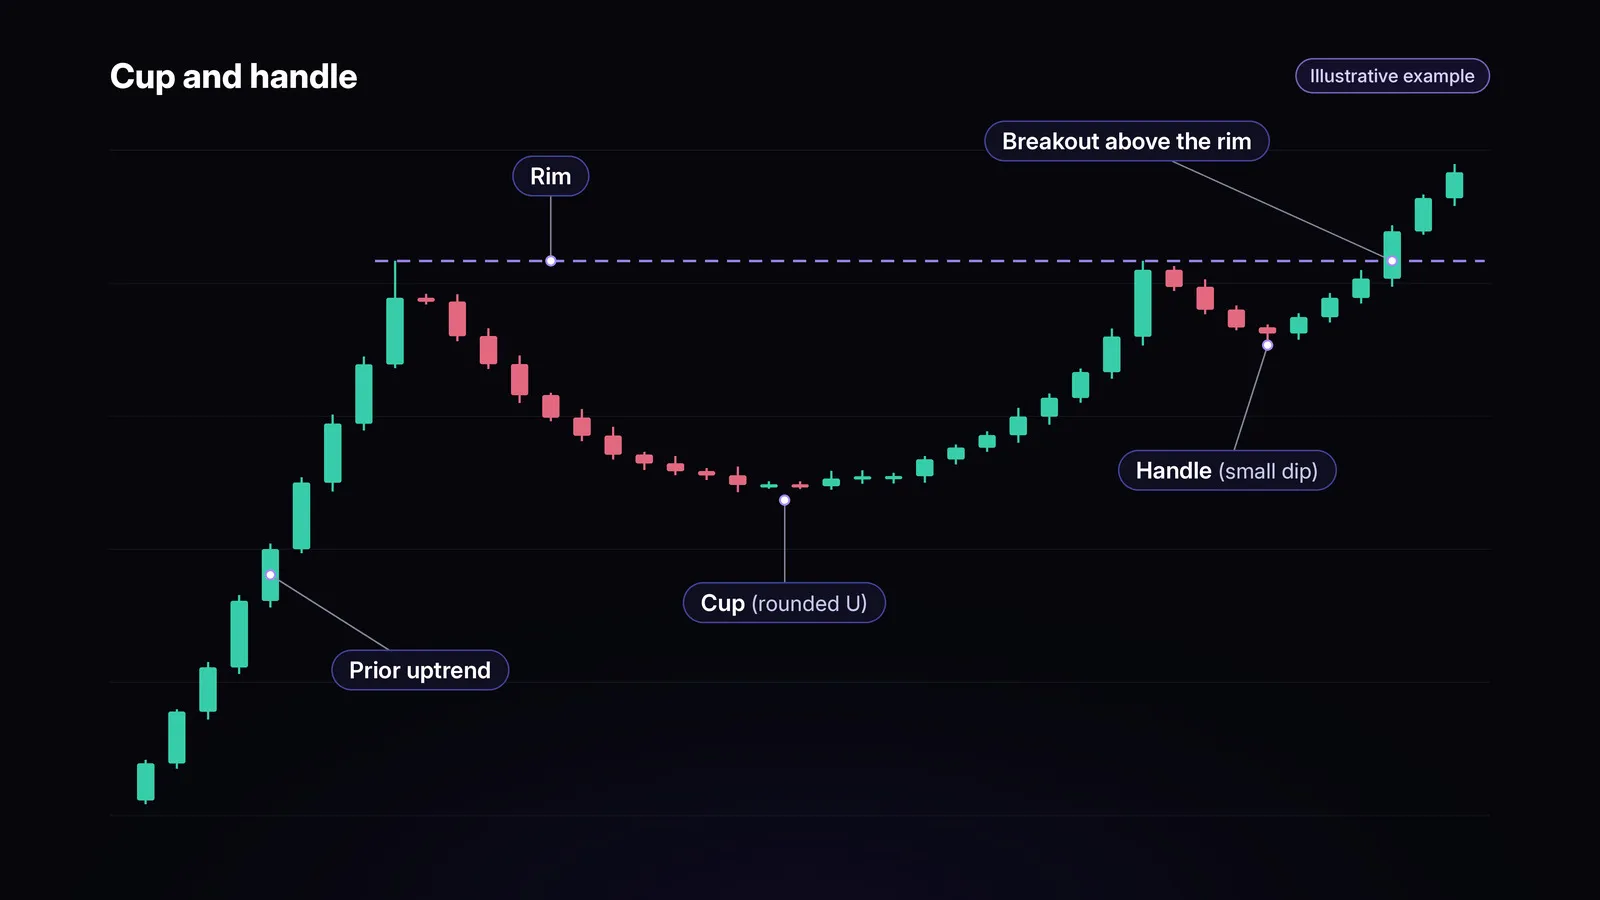
The cup and handle is a bullish continuation pattern shaped like a teacup seen from the side. Price makes a rounded dip and recovers to its old high (the cup), pulls back a little (the handle), and then may break out above the handle high.
William O’Neil, the founder of Investor’s Business Daily, defined the cup and handle pattern in his book “How to Make Money in Stocks”, first published in 1988 (Investor’s Business Daily). Like any chart pattern, it describes past price action. It does not guarantee a breakout.
Disclosure: This guide is published by Nika, an app where you can trade crypto, stocks, commodities, and forex, including Hyperliquid perpetuals. It explains standard technical analysis and is not trading advice.
The short answer
A cup and handle forms when price rises, pulls back into a rounded U-shaped base, climbs back to near the old high, and then drifts lower in a small, short pullback called the handle. Traders treat a close above the handle high as the breakout that signals the prior uptrend may resume.
- Shape: a U-shaped cup followed by a smaller, shallower handle near the right rim.
- Trigger: a close above the handle high, ideally on rising volume.
- Target: the depth of the cup added to the breakout level, as a rough guide.
Anatomy of a cup and handle pattern
The pattern has five parts. O’Neil’s numbers below are his guidelines for stocks, taken from an Investor’s Business Daily booklet by O’Neil (Investor’s Business Daily). They are not universal rules. Crypto moves can be larger and faster, so the proportions of the pattern matter more than exact percentages.
The prior uptrend
A cup and handle is a pause in an existing advance, not a bottom after a long decline. O’Neil looked for a prior rise of at least 30% before the base began.
The cup
The cup is a rounded U, not a sharp V. A rounded bottom suggests selling dried up gradually. O’Neil’s guideline for stocks was a decline of roughly 20% to 30% from the left rim, and as deep as 50% in bear markets. He wanted the whole base to take at least seven weeks on stock charts, and it can last much longer.
The handle
The handle is a short, shallow pullback near the right rim. O’Neil wrote that it should form in the upper half of the cup, last one week or more, and drift downward, typically 8% to 12% along its lows in stocks. Volume often dries up near the handle’s low.
The rim and breakout level
The handle high is the trigger level traders watch. In O’Neil’s description, the buy point comes when the stock moves up through the handle’s high.
Volume
Volume tends to be lighter in the base and in the handle, and heavier on the breakout. O’Neil’s guideline for stocks was breakout volume at least 50% above the stock’s average daily volume.
The pattern was defined on stocks, and the same shape can appear on any stock chart, for example Nvidia, which you can trade as a fractional stock on Nika.
How to tell a valid cup and handle from a lookalike
Many charts show a dip and a recovery. Check these before calling one a cup and handle:
- A rounded bottom, not a V. The cup should spend some time near its low.
- A depth that is not extreme for the market. A cup that gives back most of the prior advance is closer to a reversal than a pause. StockCharts ChartSchool suggests the cup ideally retraces a third or less of the prior advance (StockCharts ChartSchool).
- A handle in the upper half of the cup, and shorter than the cup.
- A handle that drifts down or sideways, not up.
- A breakout on above-average volume.
- A supportive broader market. A base that forms while the overall market is falling has a harder time breaking out.
Common lookalikes include a V-shaped rebound with a small wobble at the top, a handle that sinks into the lower half of the cup, and a rounded shape with no prior uptrend. The last one may be a rounding bottom, which is a reversal pattern rather than a continuation.
Where traders enter
The classic entry is a close above the handle high. That was O’Neil’s buy point: just above the handle’s high as price moves through it. It confirms the pattern first, at the cost of a slightly higher price.
There are two common alternatives. Some traders wait for a retest of the broken rim, which can give a tighter stop but means missing breakouts that never look back. Others enter early, inside the handle, to get a better price, which carries more risk that the handle keeps sinking and the pattern never completes.
Many traders set their orders around the handle high in advance instead of watching the screen. If you trade perps, this guide to Nika perps explains how they work in the Nika app.
Stop-loss and price target
Set both before you enter.
Stop-loss
The common stop sits below the handle low. If price falls back through the handle, the setup has failed. A wider alternative is below the midpoint of the cup, which gives the trade more room but means a larger loss when it fails. A stop is a trigger, not a guaranteed fill. In a fast move or a gap, it can fill at a worse price.
Measured-move target
The common convention for a target is the measured move: measure the depth of the cup, from the rim down to the bottom, and add that distance to the breakout level (StockCharts ChartSchool). Treat it as a rough reference. Price can fall short or overshoot. Thomas Bulkowski, who publishes chart pattern statistics, writes that the full-height measure rule “doesn’t work well” and suggests scaling it down (ThePatternSite).
Worked example
The numbers below are hypothetical round numbers for illustration, not a real chart or a forecast.
| Step | Price |
|---|---|
| Rim (old high) | 50 |
| Cup bottom | 40 (depth of 10) |
| Handle low | 46 (an 8% dip from the rim) |
| Breakout level and entry | 50.50 |
| Stop, below the handle low | 45.80 |
| Measured-move target | 60.50 (50.50 + 10) |
| Risk per unit | 4.70 (50.50 minus 45.80) |
| Potential reward per unit | 10 |
The trader risks 4.70 to aim for 10, a reward-to-risk ratio of about 2.1 to 1. That ratio says nothing about how likely the target is. The example excludes fees, spread, slippage, and funding on perps.
If you use leverage, compare your stop with your liquidation price; the stop should trigger first. The Nika app shows an estimated liquidation price before you confirm a perp trade, and this guide to Hyperliquid liquidation prices explains the math.
The inverse cup and handle
The inverse cup and handle is the bearish mirror. After a decline, price forms an upside-down cup: a rounded rise and fall back to the old low. Then a small bounce forms the handle, and the pattern confirms on a close below the handle low. The stop usually goes above the handle high, and by the same measured-move convention, traders subtract the cup’s height from the breakdown level.
The same caveats apply, and the inverse version can fail quickly when the broader trend is up.
Traders who act on a bearish setup often use a short position. On Nika, perpetual futures on Hyperliquid let you go long or short, and Nika provides access to 500+ markets, including crypto, stocks, commodities, and forex.
Why the cup and handle fails
The pattern fails in a few common ways.
- Breakouts that reverse. Price clears the handle high, then falls back into the handle and stops out early buyers.
- Handles that sink too deep. A handle that drops into the lower half of the cup signals more selling than a pause should have.
- Weak breakout volume. A breakout without a pickup in volume has less conviction behind it.
- A weak overall market. Many stocks move with the broader market, so a base can fail simply because the index turns down.
- News events. Earnings, guidance changes, and macro data can override the pattern in one session.
- 24/7 trading and sharp wicks in crypto. A brief wick through the handle low can trigger a stop before price recovers.
There is no fixed success rate for the cup and handle. Published statistics depend on the market, the period studied, and how the pattern and the trade were defined, and they describe history rather than predict the next breakout.
Cup and handle in crypto, stocks, and gold
The shape is the same everywhere, but the timing and depth differ.
- Stocks are the original use case. O’Neil studied the pattern on daily and weekly charts of growth stocks, where bases often form over weeks to months.
- Crypto bases tend to form faster and can run deeper, so judge the proportions of the pattern rather than O’Neil’s percentages.
- Gold and silver can build long, rounded bases that follow interest rate and inflation cycles, sometimes over many months on weekly charts.
Compared with other patterns, bull and bear flags are short, sharp pauses after a fast move, while a cup and handle is a slower, rounded base. A rounding bottom has the cup without the handle and usually marks a reversal. A double bottom has two distinct lows instead of one rounded one.
From one Nika account, you can watch for the pattern on Bitcoin, stocks such as Apple and Tesla, the S&P 500, gold, and silver.
Trading a cup and handle with leverage
Chart patterns fail often, and leverage magnifies losses as well as gains.
- Size so a failed breakout is a small, fixed loss. Work out the distance from entry to stop, then size the position so that hitting the stop costs a small, fixed share of the account.
- Leverage amplifies both sides. It does not make the breakout more likely, and it moves your liquidation price closer to your entry.
- Holding a perp means funding. A cup and handle can take weeks to play out, and funding payments add up over that time. This explains how perpetuals differ from dated futures.
Read more about the risks of trading with leverage.
Hyperliquid perps on Nika offer leverage of up to 50x, with isolated or cross margin, depending on the market. In isolated margin, a liquidation affects only that position and its margin, so one failed setup does not touch your other positions’ margin.
Frequently asked questions
Is a cup and handle bullish or bearish?
The standard cup and handle is bullish, a continuation pattern in an uptrend. The inverse cup and handle is its bearish mirror.
How long does a cup and handle take to form?
O’Neil’s guideline for stocks was a base of at least seven weeks, with a handle of at least one week. On intraday and crypto charts, the pattern can form much faster.
How reliable is the cup and handle pattern?
There is no fixed reliability figure. Results depend on the market, the timeframe, volume, and the overall trend, and the pattern fails often enough that a stop and careful sizing matter.
What happens after a cup and handle breakout?
Price may run toward the measured-move target, pull back to retest the rim, or fail and fall back into the handle.
Does the cup and handle work in crypto?
The shape appears on crypto charts, but 24/7 trading and higher volatility can make bases form faster and run deeper. Judge the proportions rather than stock-market percentages, and set stops with sharp wicks in mind.
Can I trade a cup and handle setup on Nika?
Yes. Nika provides access to 500+ markets, including crypto, stocks, commodities, and forex, where the pattern can form, and its Hyperliquid perps let you go long or short. Spotting the pattern and deciding whether to trade it is up to you.
Sources
- Investor’s Business Daily, How To Recognize Great Performing Stocks (William J. O’Neil, cup-with-handle booklet)
- Investor’s Business Daily, New Book Shows Anyone Can Win With IBD Rules
- StockCharts ChartSchool, Cup With Handle
- Thomas Bulkowski, ThePatternSite, Measure Rule
Sources checked on 30 October 2026.
Explore Nika
Follow stocks, crypto, gold, and forex charts in one self-custodial app.
Open Nika to trade crypto, stocks, commodities, and forex, including Hyperliquid perps that let you go long or short. Nika provides access to 500+ markets. Gas fees are covered automatically in the Nika app. Nika is self-custodial: Privy provides the wallet infrastructure, and Nika doesn’t hold users’ private keys. You can browse all markets on Nika, or get the Nika app on iPhone and Android.
Access to perpetuals and prediction markets is subject to the underlying protocols’ terms and availability.
