
What Are the Most Common Crypto Chart Patterns?
Crypto chart patterns are shapes in price action that traders use to spot possible breakouts and reversals. Learn the common ones and why they often fail.
Crypto chart patterns are shapes that price action draws on a chart, such as flags, triangles, and double tops, that traders use to judge whether a trend is likely to continue or reverse. The most common ones fall into two groups: continuation patterns and reversal patterns. None of them predicts the future. Patterns are not guarantees, and this guide covers how each one looks, what confirms it, and why they fail.
Disclosure: This guide is published by Nika, a non-custodial app where you can access spot trading, perpetual futures, prediction markets, and yield. It explains standard technical analysis using StockCharts ChartSchool and other primary sources, and it is not trading advice.
What are crypto chart patterns? The short answer
A chart pattern is a recognizable shape in price and volume that traders read as a clue about the next move. StockCharts ChartSchool says chart patterns put buying and selling “into perspective by consolidating the forces of supply and demand into a concise picture,” and that most “fall into two main groups,” reversals and continuations (StockCharts).
| Pattern | Type | Usual bias | What confirms it |
|---|---|---|---|
| Bull flag | Continuation | Bullish | A break above the flag’s upper line |
| Bear flag | Continuation | Bearish | A break below the flag’s lower line |
| Pennant | Continuation | Follows the prior move | A break in the direction of the pole |
| Cup and handle | Continuation | Bullish | A break above the handle high |
| Ascending triangle | Usually continuation | Bullish | A break above the flat top |
| Descending triangle | Usually continuation | Bearish | A break below the flat bottom |
| Symmetrical triangle | Usually continuation | None until the break | A break of either line |
| Rectangle | Usually continuation | None until the break | A break of the range |
| Double top | Reversal | Bearish | A close below the trough between the peaks |
| Double bottom | Reversal | Bullish | A close above the peak between the troughs |
| Head and shoulders | Reversal | Bearish | A break below the neckline |
| Inverse head and shoulders | Reversal | Bullish | A break above the neckline, with volume |
| Triple top | Reversal | Bearish | A break below support |
| Triple bottom | Reversal | Bullish | A break above resistance |
| Rising wedge | Reversal or continuation | Bearish | A break below the lower line |
| Falling wedge | Reversal or continuation | Bullish | A break above the upper line, with volume |
How to read a crypto chart before you look for patterns
Patterns only make sense once you can read the chart underneath them. Four things matter most:
- Candles. Each candlestick shows the open, high, low, and close for one period. ChartSchool calls the thick part “the body,” and the thin lines above and below “shadows,” also known as “wicks” (StockCharts).
- Timeframes. The same market can show a flag on a 1-hour chart and a downtrend on a daily chart. ChartSchool notes that pattern data “can be intraday, daily, weekly, or monthly” (StockCharts). Check at least one longer timeframe before you act on a shorter one.
- Volume. Volume shows how much traded during each candle. Some patterns below, such as the inverse head and shoulders and the falling wedge, need a volume pickup on the break.
- Support and resistance. ChartSchool defines support as “the price level at which demand is thought to be strong enough to prevent the price from declining further,” and resistance as the level where “selling is thought to be strong enough to prevent the price from rising further” (StockCharts). Flags, triangles, rectangles, and double tops are all drawn with these lines.
Continuation patterns
Continuation patterns are pauses. ChartSchool says they “indicate a pause in trend and that the previous direction will resume after some time” (StockCharts).
Bull and bear flags
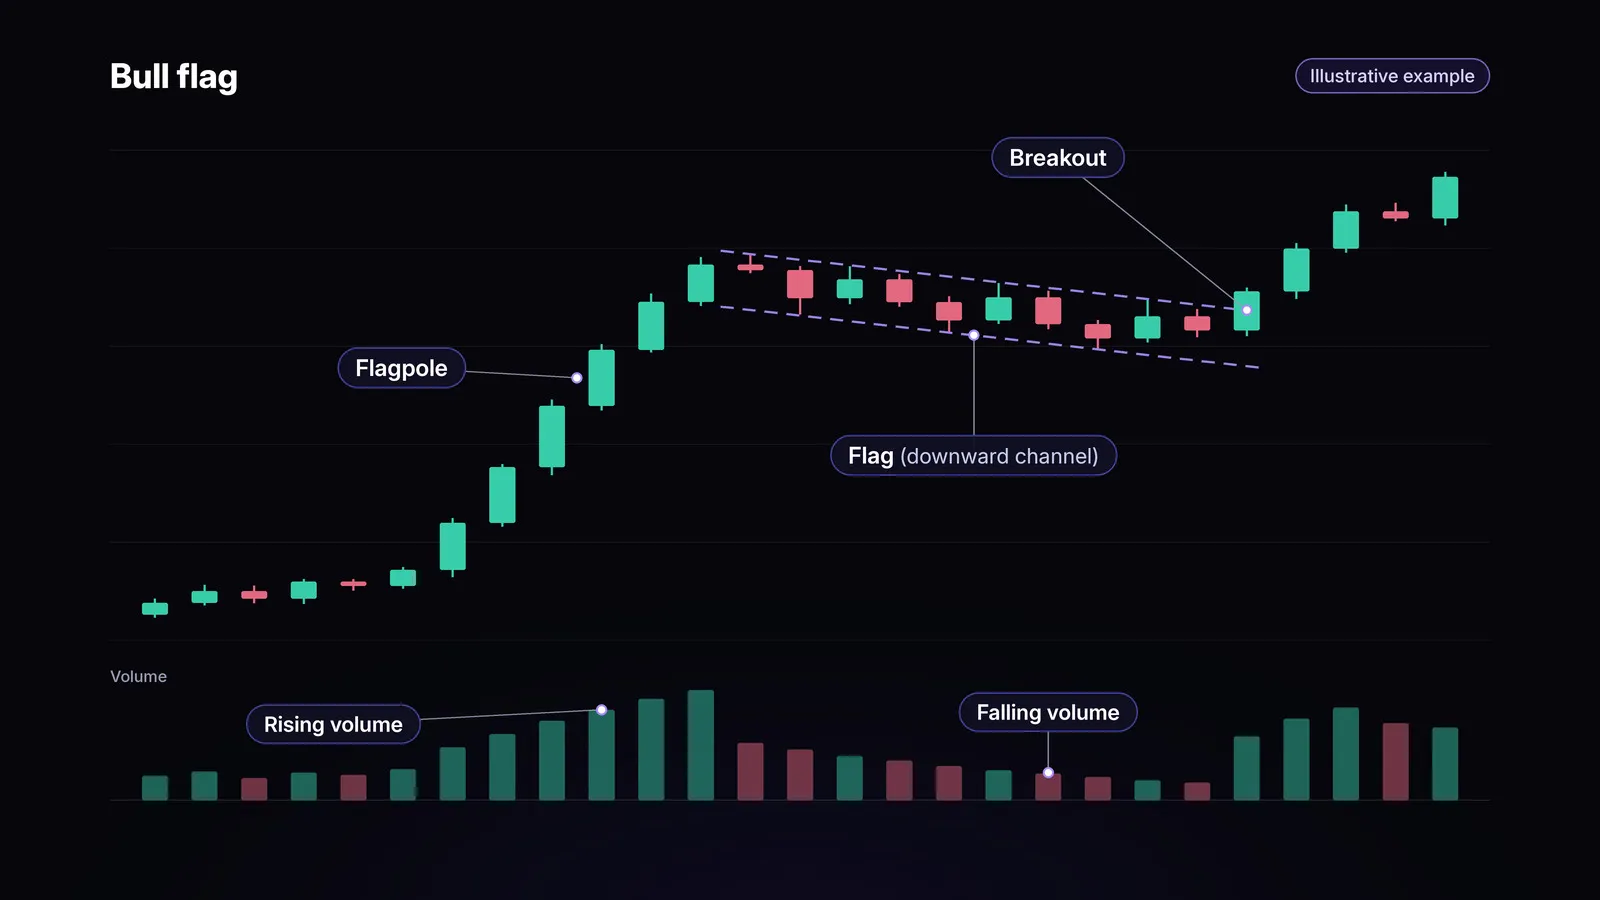
A flag is a short pause after a sharp move. ChartSchool describes it as “a small rectangle pattern that slopes against the previous trend,” formed after a sharp advance or decline that creates the flagpole (StockCharts). A bull flag drifts down after a rally, and a bear flag drifts up after a drop. The signal comes when price breaks out of the flag in the direction of the pole. Our full guide to bull and bear flags covers entries, stops, and targets.
Pennants
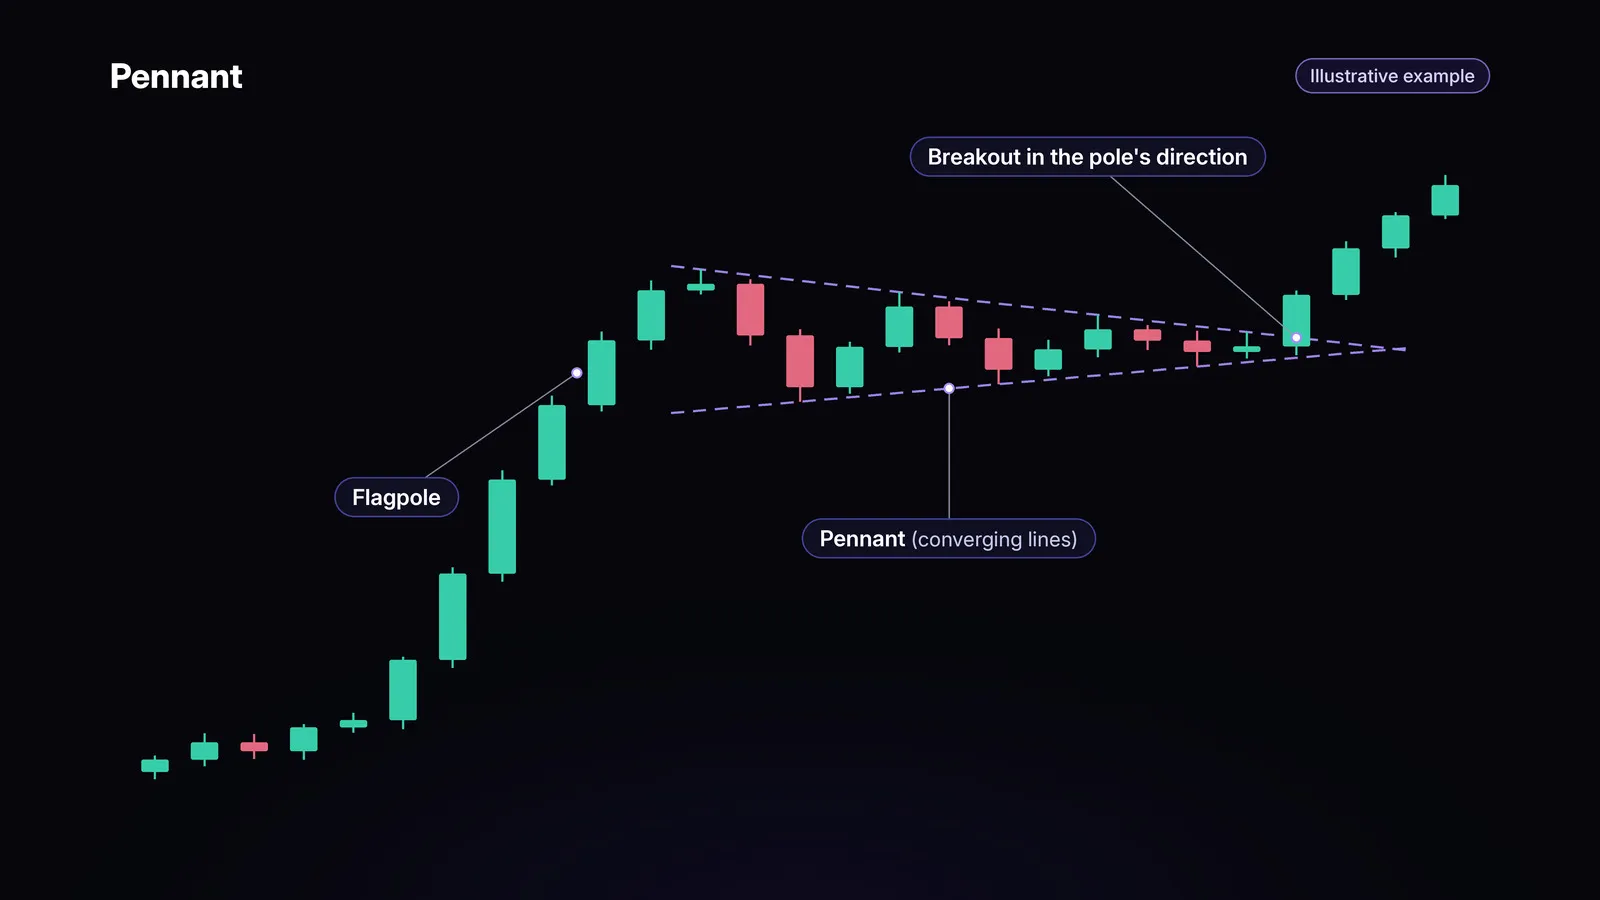
A pennant is a flag with converging lines. ChartSchool calls it “a small symmetrical triangle that begins wide and converges as the pattern matures,” and says flags and pennants are “short-term patterns lasting from one to 12 weeks” (StockCharts). Like a flag, a pennant needs a sharp move before it, and ChartSchool treats a symmetrical triangle shorter than three weeks as a pennant (StockCharts). The break is expected in the direction of the pole, and ChartSchool says a volume expansion on the break “lends credence” to it (StockCharts).
Cup and handle
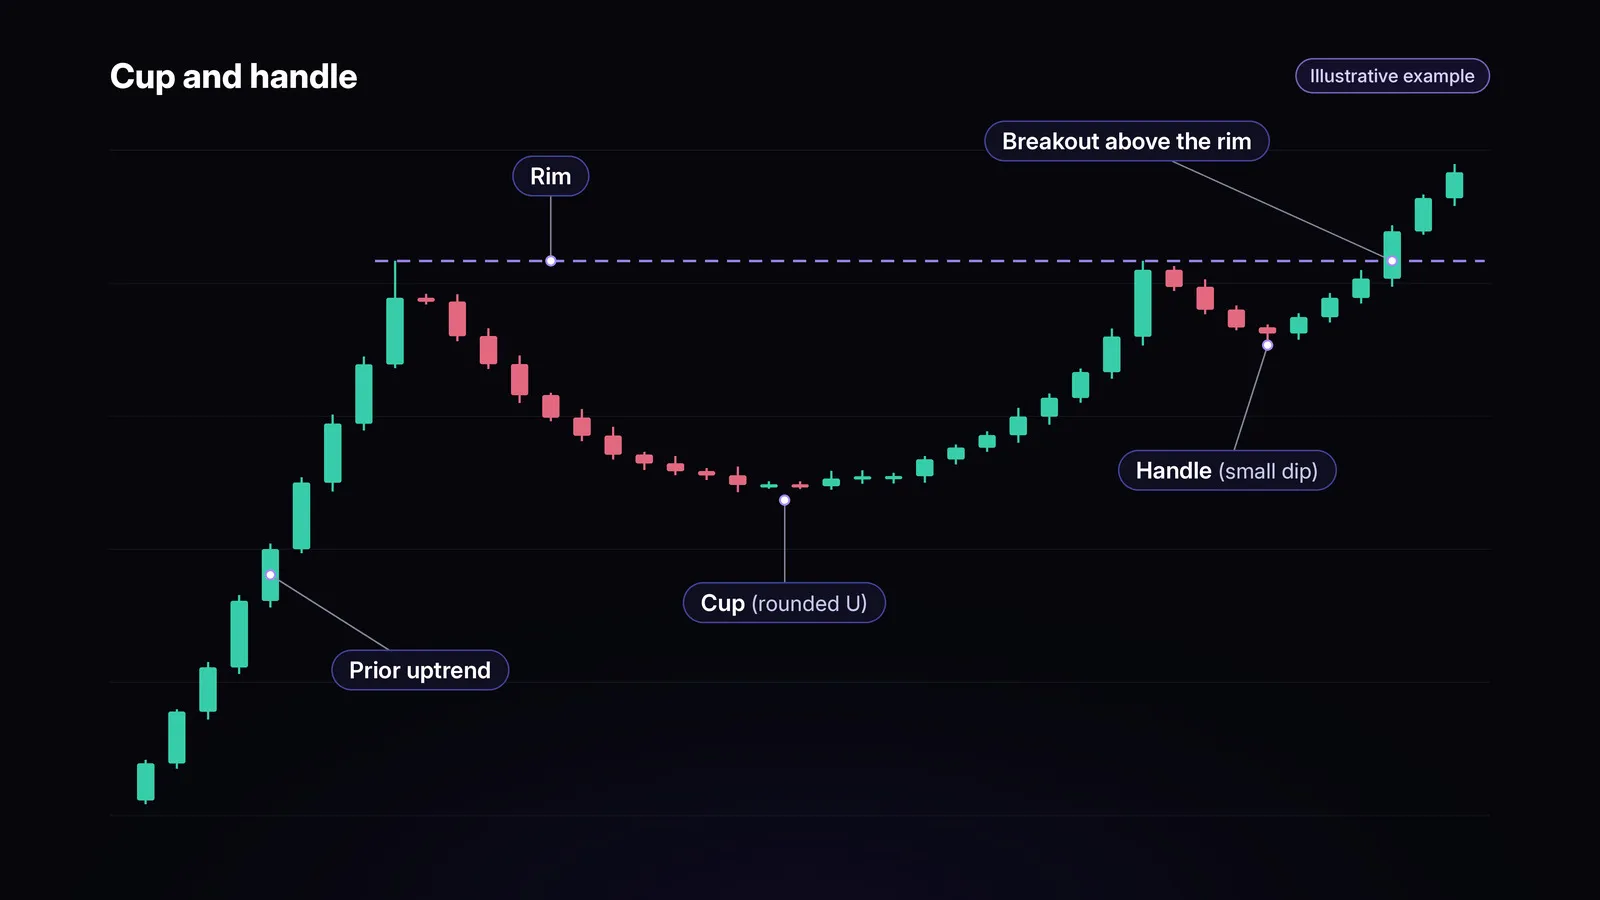
The cup and handle is a rounded base followed by a small pullback. ChartSchool calls it “a bullish continuation pattern that marks a consolidation period followed by a breakout,” developed by William O’Neil in his 1988 book (StockCharts). The cup should look like a bowl, not a V, and the handle forms as a short drift on the right side. The signal is a break above the handle high. See our guide to the cup and handle pattern for the full setup.
Triangles
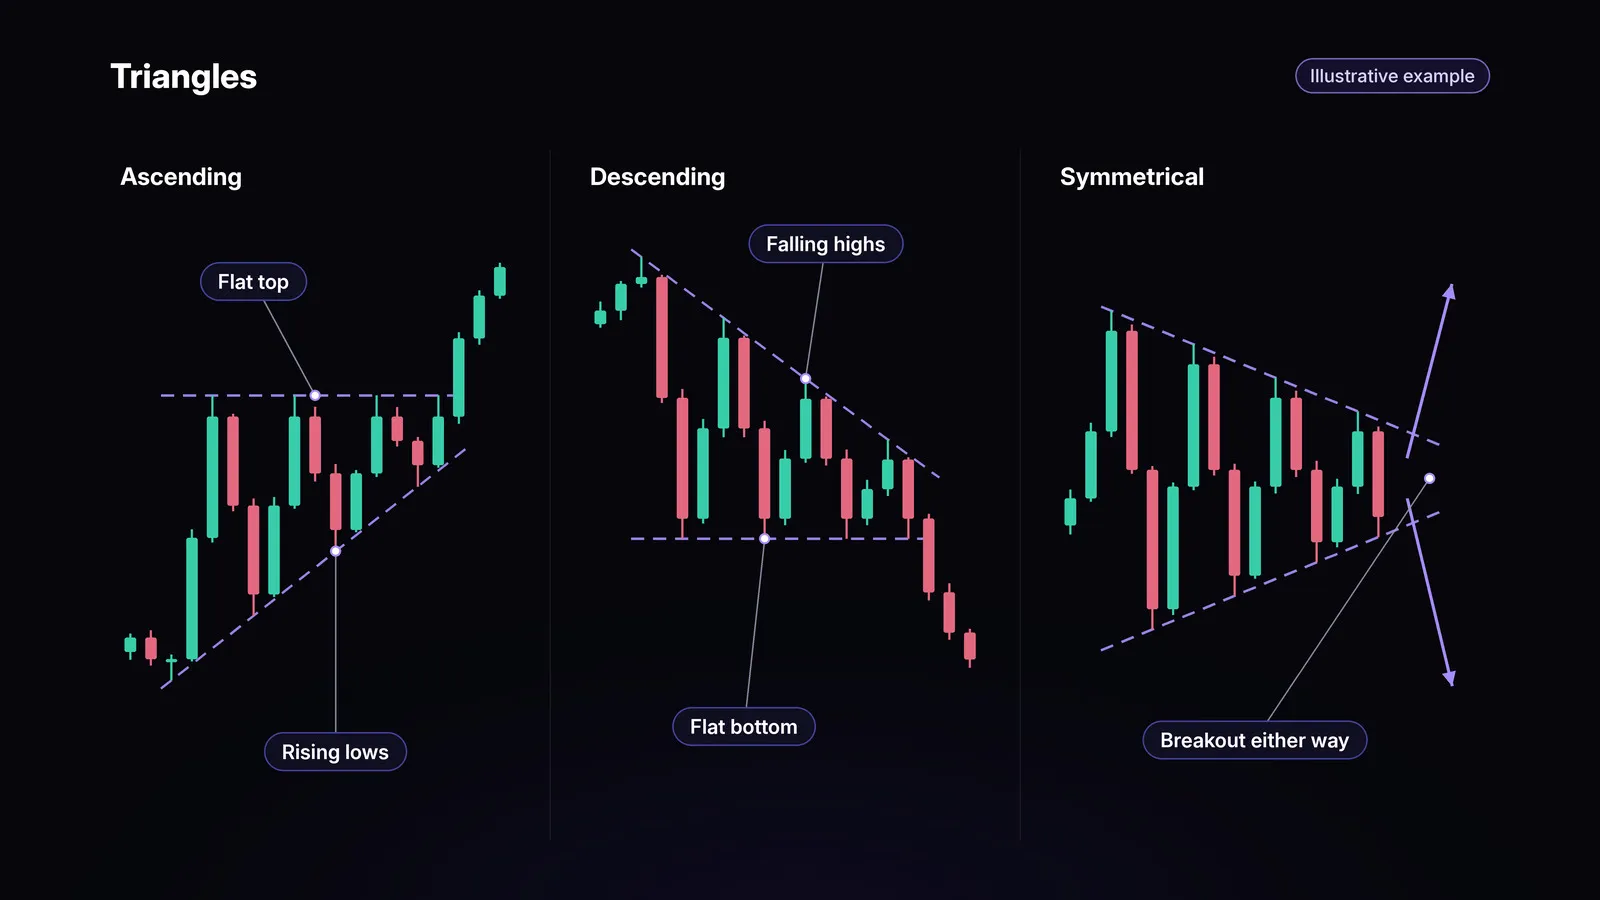
Triangles form as the range narrows. An ascending triangle has a flat top and rising lows, and ChartSchool calls it “a bullish formation that usually forms as a continuation pattern during an uptrend” (StockCharts). A descending triangle has a flat bottom and falling highs, and is “a bearish formation” (StockCharts). A symmetrical triangle has both lines converging, and ChartSchool says “the direction of the next major move can only be determined after a valid breakout” (StockCharts).
Rectangles
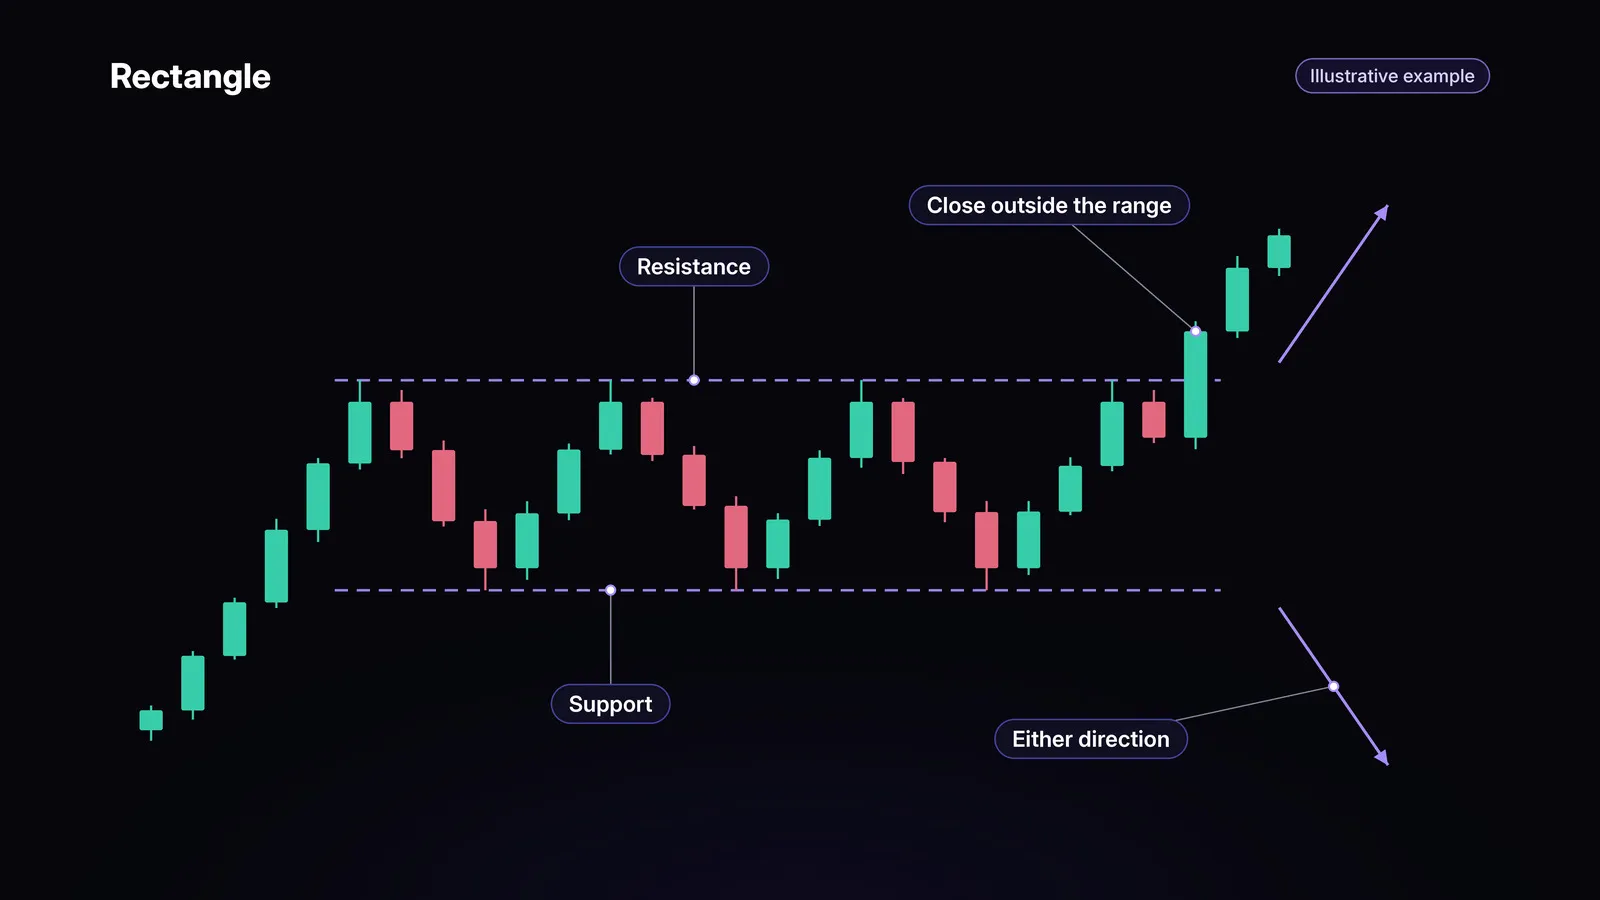
A rectangle is a sideways range between two flat lines. ChartSchool calls it “a continuation pattern that forms during a pause in the trend,” also known as a trading range or consolidation zone. The catch is direction: “the direction of the breakout is usually not determinable beforehand” (StockCharts). Wait for a close outside the range, and treat a quick move back inside as a failed break.
Reversal patterns
Reversal patterns mark a possible change of trend. ChartSchool says they “indicate a trend change and can be broken down into top and bottom formations.” Every reversal pattern needs a prior trend to reverse.
Double top and double bottom
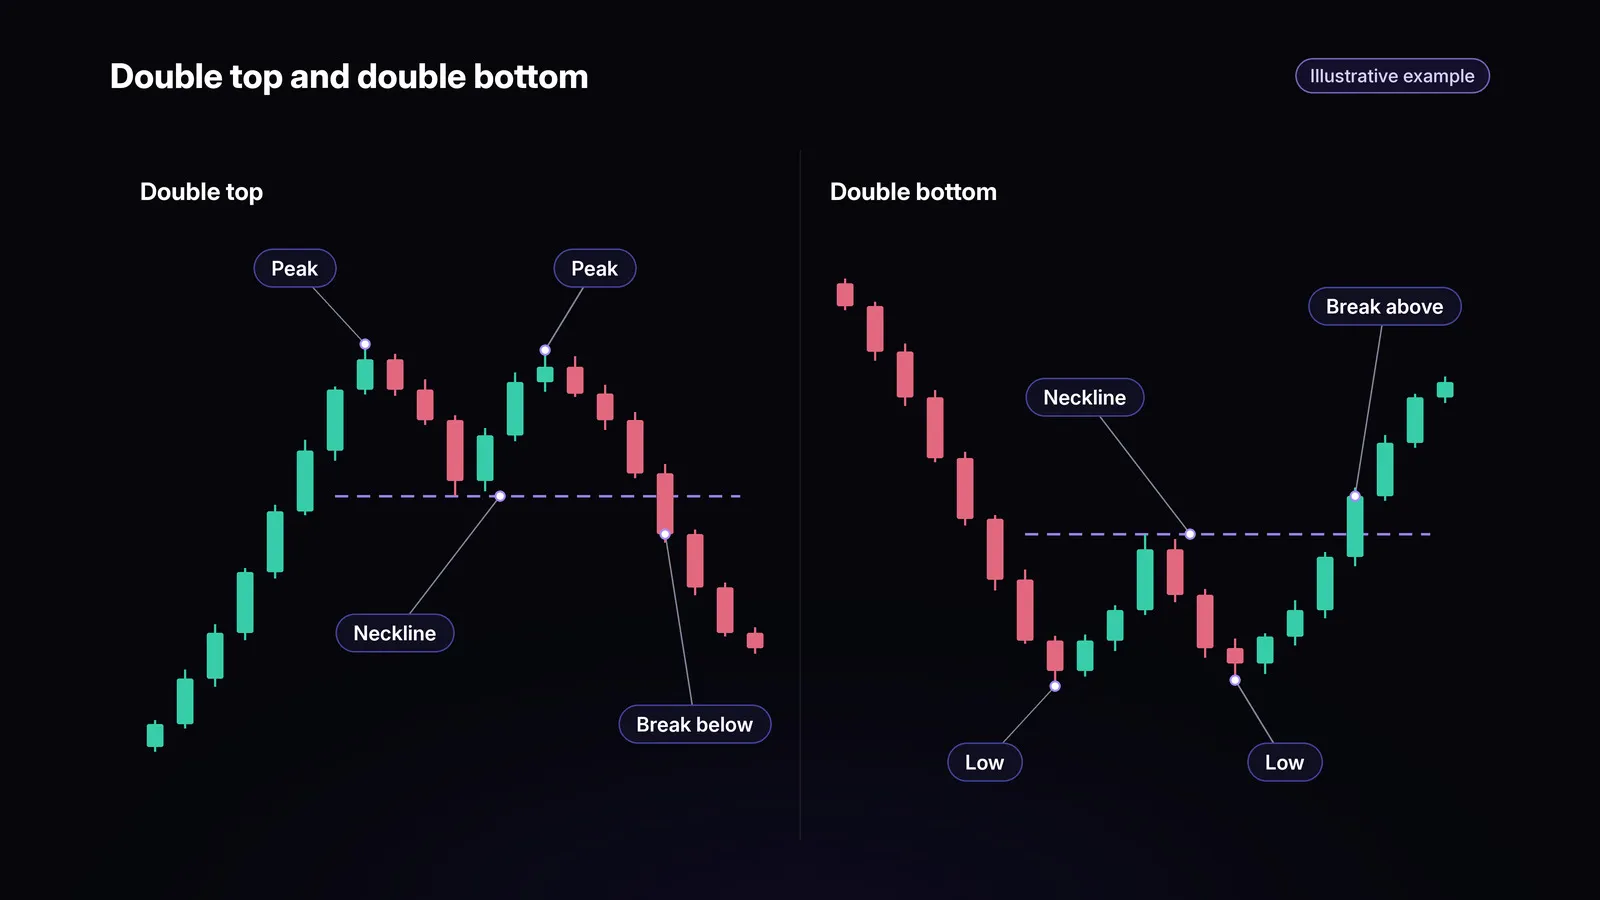
A double top is two roughly equal peaks with a trough between them. ChartSchool calls it “a bearish reversal pattern” and warns that “until key support is broken, a reversal cannot be confirmed” (StockCharts). A double bottom is the mirror image, two roughly equal lows after a downtrend, confirmed by a break above the peak between them. Our guide to double top and double bottom patterns explains entries, stops, and the measured move.
Head and shoulders and the inverse
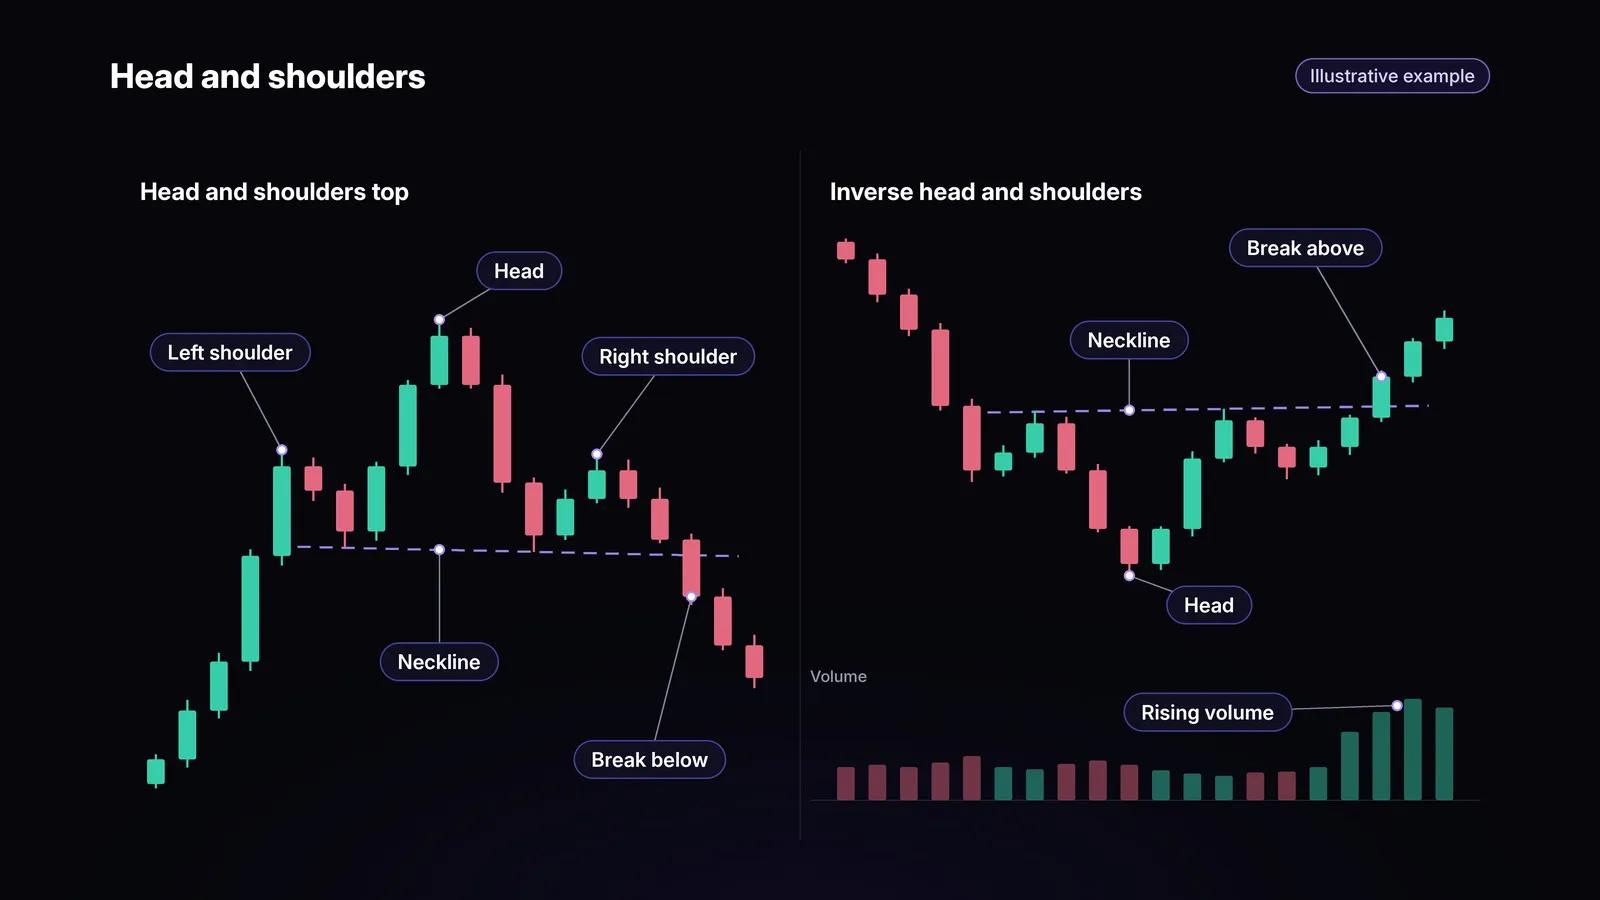
A head and shoulders top has three peaks, with the middle one highest. ChartSchool says it “forms after an uptrend” and “its completion marks a trend reversal,” with the lows between the peaks forming the neckline (StockCharts). The inverse, or head and shoulders bottom, has three troughs with the middle one deepest. Volume matters more there: ChartSchool says a volume increase on the neckline breakout is welcome for a top but “absolutely required for a bottom” (StockCharts).
Triple top and triple bottom
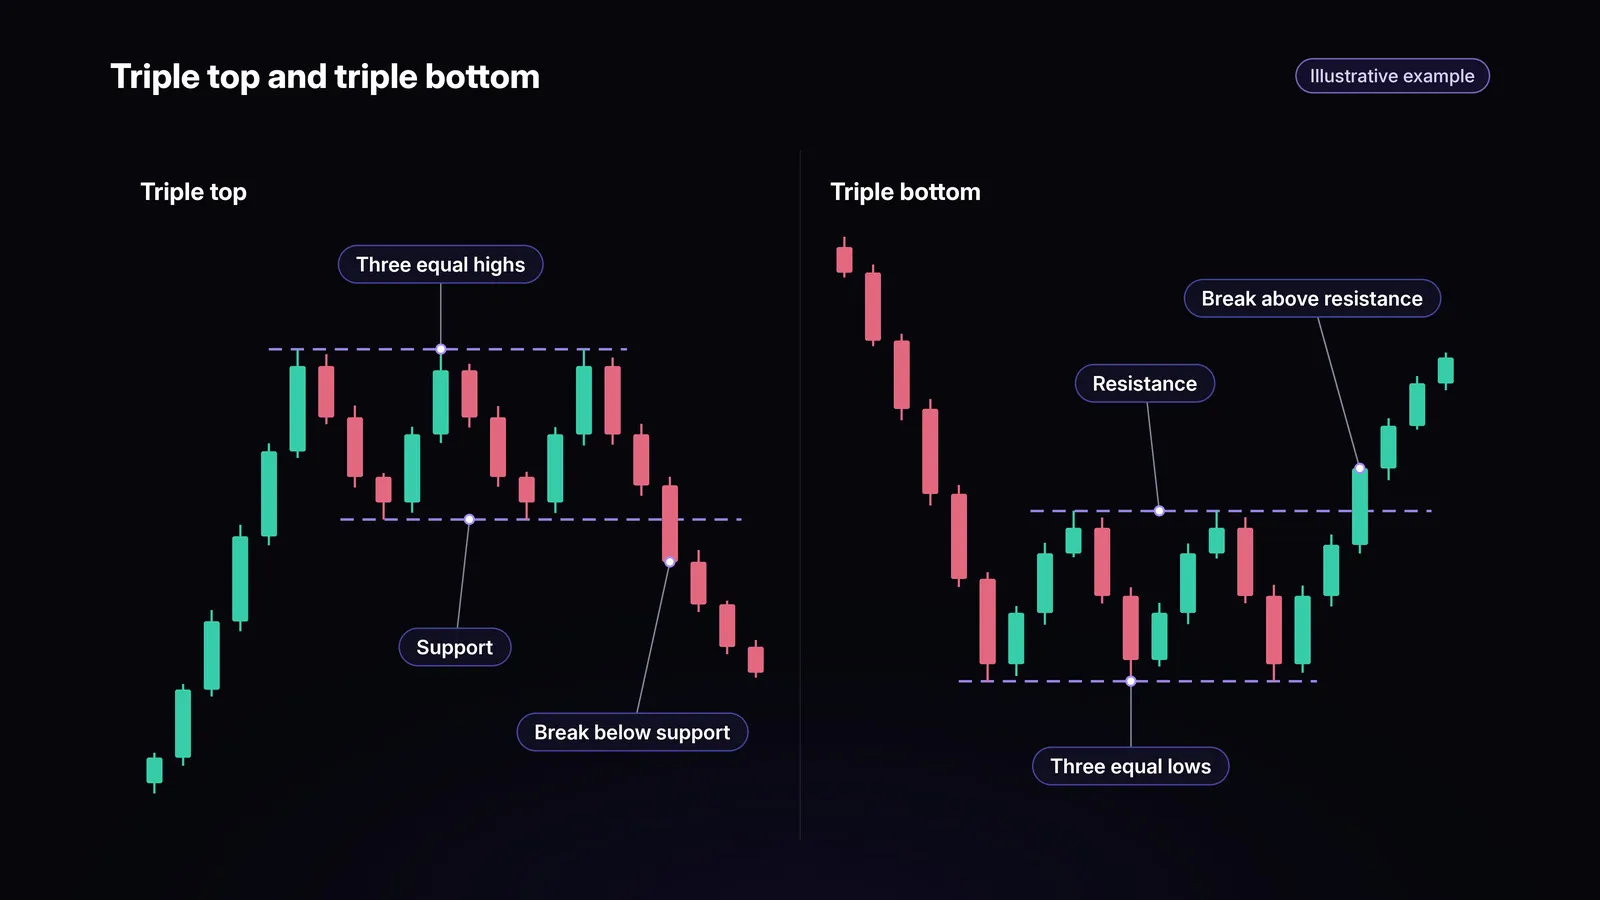
A triple top is three roughly equal highs, and a triple bottom is three roughly equal lows. ChartSchool describes the triple top as “three equal highs followed by a break below support,” and says it “is not complete until a support break” (StockCharts). The triple bottom is confirmed by a break above resistance (StockCharts). Until that break, three touches of the same level can just as easily be a range.
Rising and falling wedges
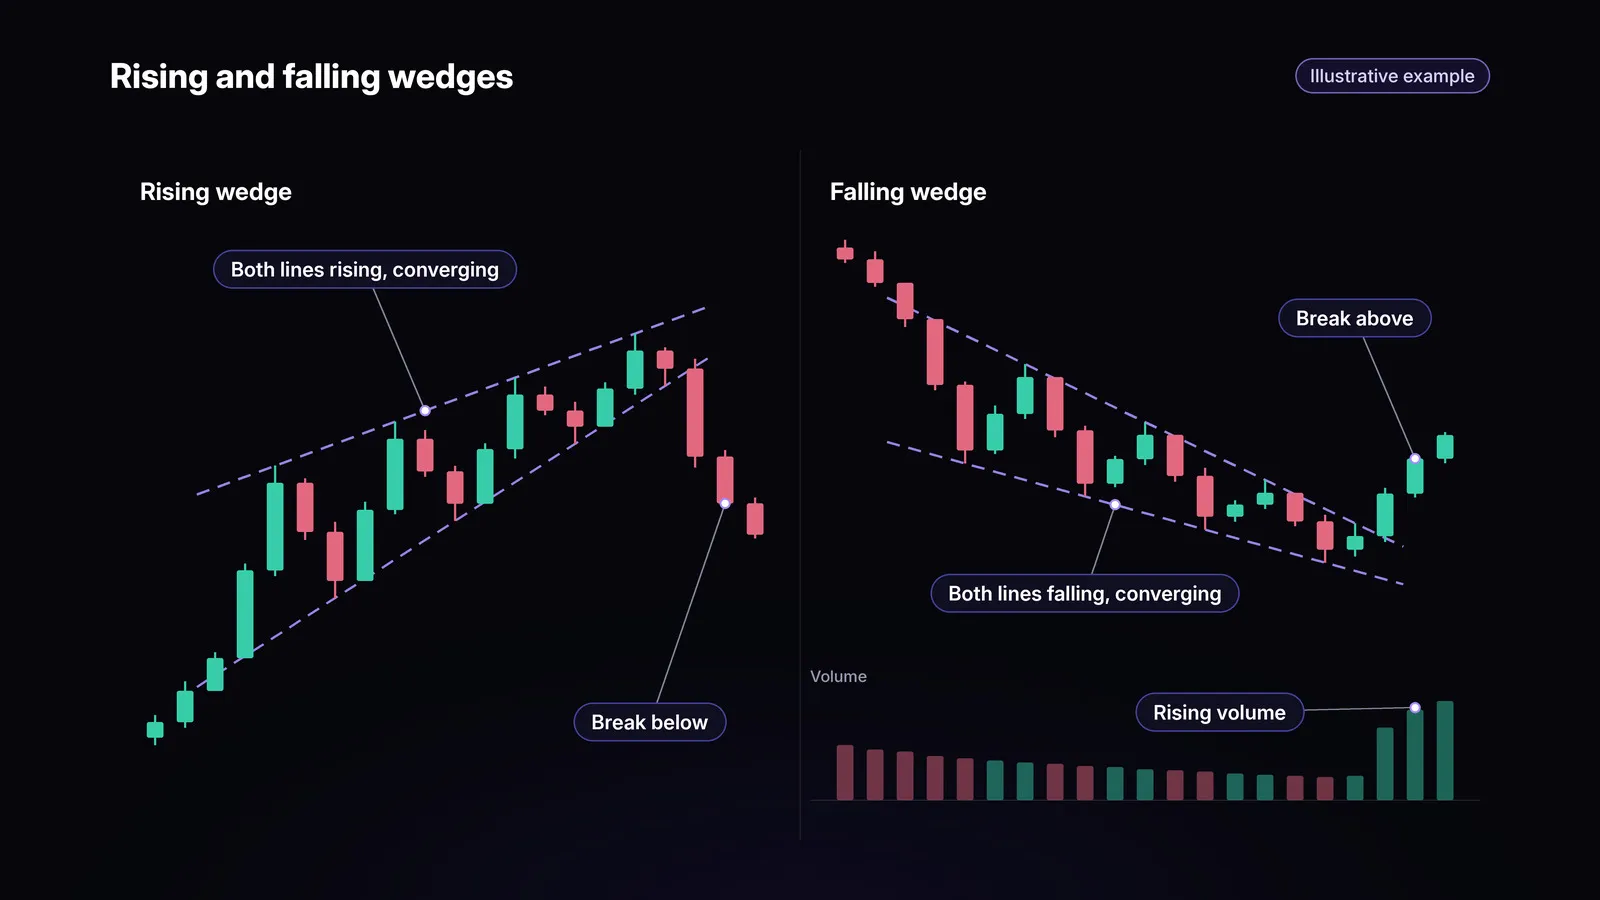
Wedges slope, which separates them from triangles. A rising wedge narrows as price climbs, and ChartSchool says “regardless of the type (reversal or continuation), rising wedges are bearish” (StockCharts). A falling wedge narrows as price drops and is “regarded as bullish.” For a falling wedge, volume is “an essential ingredient to confirm” the breakout (StockCharts). ChartSchool also calls the falling wedge “one of the most difficult chart patterns to recognize and trade accurately.”
Why no pattern has a fixed success rate
You will see lists that rank patterns by success rate. Treat them with care. Thomas Bulkowski, who publishes chart pattern statistics, ranks patterns “based on failure rate and the average rise or decline after the breakout,” with separate results for upward and downward breakouts, and his ranking pages were last updated in 2020 (ThePatternSite). He also finds that the common full-height target rule “doesn’t work well” and publishes separate tables for bull markets (ThePatternSite).
That shows why a single answer does not exist. Results depend on the market, the period studied, the breakout direction, and the exact rules used to define the pattern and the trade. Statistics describe history, and they do not predict your next trade.
Moving average crossovers
The golden cross and death cross are not shapes. They are signals from two moving averages. ChartSchool defines a golden cross as “a bullish pattern in which a faster and short-term moving average crosses above a slower and longer-term moving average,” most commonly the 50-day against the 200-day (StockCharts). A death cross is the reverse, when the 50-day “crosses below” the 200-day (StockCharts).
Because moving averages are built from past prices, both signals lag. ChartSchool frames them as describing conditions rather than calling a trend: when the 50-day sits above the 200-day, “it generally indicates bullish conditions.” In crypto, a 50-day average covers 50 full days of 24-hour trading, so it is not directly comparable with the same setting on a stock chart.
Chart patterns in 24/7 crypto markets
The shapes are the same on crypto charts. The market around them is different:
- No closing bell. When CME Group announced 24/7 crypto futures and options trading on 1 June 2026, it pointed to “the 24/7 nature of crypto assets” (CME Group). Crypto trades around the clock rather than having a daily closing bell.
- Wicks. Treat a touch of the pattern line and a candle close beyond it as different events. ChartSchool uses a closing-price breakout to confirm a rectangle (StockCharts). Confirmation does not guarantee that the breakout will hold.
- Execution. A pattern line is not a guaranteed fill price. Investor.gov notes that a market order’s execution price is not guaranteed (Investor.gov). Check the order type and expected execution price before acting on a breakout.
- Liquidations. On leveraged perps, forced closes add selling or buying of their own. On Hyperliquid, a liquidation first tries to close the position “by sending market orders to the book” (Hyperliquid), which can push price further through a pattern line.
A checklist before trading any pattern
- Confirmation. Has price closed beyond the breakout line on the timeframe you are trading?
- Volume. Did volume expand on the break, especially for patterns that need it, such as the inverse head and shoulders and the falling wedge?
- Stop. Where is the trade idea wrong? Place the stop there, and decide whether you need a stop loss that prioritizes execution or a stop limit that protects your price. Our guide to stop loss vs stop limit orders explains the trade-off.
- Target. What is a realistic target, and does the reward justify the distance to the stop?
- Size. If the stop is hit, is the loss a small, fixed share of your account?
- Bigger picture. Does the pattern agree with the trend on a longer timeframe?
Trading chart patterns with leverage
Chart patterns can fail, and leverage magnifies losses as well as gains. Leverage does not make a breakout more likely. For isolated margin, a higher leverage setting allocates less margin to a position and can move its liquidation price closer to entry. On Hyperliquid, the liquidation price of a cross-margin position is independent of its leverage setting (Hyperliquid). Check the margin mode and estimated liquidation price before placing a trade. Our guide to how a liquidation price is set shows the math.
Time matters too. A triangle or head and shoulders can take weeks or months to play out. On a perpetual, you pay or receive funding the whole time, and on Hyperliquid funding “is paid every hour” (Hyperliquid). If you are new to perps, start with how perpetuals differ from dated futures, then read about the risks of trading with leverage.
Chart patterns and Nika
You can trade 500+ markets on Nika, including crypto, fractional tokenized stocks such as NVDA, commodities, and forex, where these patterns form. Perpetual trading on Nika connects you to Hyperliquid, so you can go long or short, with up to 50x leverage and isolated and cross margin, both depending on the market. Nika supports limit, market, and stop-limit orders, and the Nika app shows an estimated liquidation price before you confirm a perp trade. Spotting the pattern and deciding whether to trade it is up to you.
Nika is non-custodial, so you, and only you, control your assets. Nika does not hold your private keys. Gas fees are covered automatically in the Nika app.
Access to perpetuals and prediction markets is subject to the underlying protocols’ terms and availability.
You can get the Nika app on iPhone and Android.
Frequently asked questions
Do chart patterns work in crypto?
The same shapes appear on crypto charts, and you can trade them with the same rules for confirmation, stops, and targets. They fail often, in crypto as anywhere else. Sharp wicks, thin order books on small coins, and liquidations can push price through a pattern line and back, so wait for a close beyond the line and size your trade for the failure case.
What is the most successful chart pattern?
There isn’t one. A pattern with a strong record in published rankings can still fail on your next trade, so your stop and position size matter more than its rank.
What is the best chart timeframe for crypto?
Choose a timeframe to match how long you plan to hold, and compare it with a longer one for context. ChartSchool notes that chart-pattern data “can be intraday, daily, weekly, or monthly” (StockCharts). A 1-hour flag inside a daily uptrend is a different setup from one inside a daily downtrend.
What is the difference between a golden cross and a death cross?
A golden cross is bullish: a shorter moving average, usually the 50-day, crosses above a longer one, usually the 200-day. A death cross is the bearish opposite, with the shorter average crossing below.
What is the difference between continuation and reversal patterns?
A continuation pattern is a pause before the trend resumes. A reversal pattern marks a possible change of direction, so it needs a trend to reverse.
Sources
- StockCharts ChartSchool: Introduction to chart patterns
- StockCharts ChartSchool: Introduction to candlesticks
- StockCharts ChartSchool: Support and resistance
- StockCharts ChartSchool: Flag, pennant
- StockCharts ChartSchool: Cup with handle
- StockCharts ChartSchool: Ascending triangle
- StockCharts ChartSchool: Descending triangle
- StockCharts ChartSchool: Symmetrical triangle
- StockCharts ChartSchool: Rectangle
- StockCharts ChartSchool: Double top reversal
- StockCharts ChartSchool: Head and shoulders top
- StockCharts ChartSchool: Head and shoulders bottom
- StockCharts ChartSchool: Triple top reversal
- StockCharts ChartSchool: Triple bottom reversal
- StockCharts ChartSchool: Rising wedge
- StockCharts ChartSchool: Falling wedge
- StockCharts ChartSchool: Trading using the golden cross
- StockCharts ChartSchool: Trading the death cross
- ThePatternSite: Bulkowski’s chart and event pattern rank, updated 24 August 2020
- ThePatternSite: Measure rule, statistics updated 14 September 2020
- CME Group: Launch of 24/7 cryptocurrency futures and options trading, 1 June 2026
- Hyperliquid Docs: Liquidations
- Hyperliquid Docs: Funding
Sources checked on 8 November 2026.
Explore Nika
Nika brings spot and perpetual trading, prediction markets, and yield into one non-custodial app.
Open Nika to trade crypto, fractional tokenized stocks, commodities, and forex, or explore 500+ markets on Nika.
Access to perpetuals and prediction markets is subject to the underlying protocols’ terms and availability.
