
What Are Double Top and Double Bottom Patterns?
A double top pattern is a bearish reversal with two peaks, and a double bottom is the bullish W. Learn how to spot, confirm, and trade both patterns.
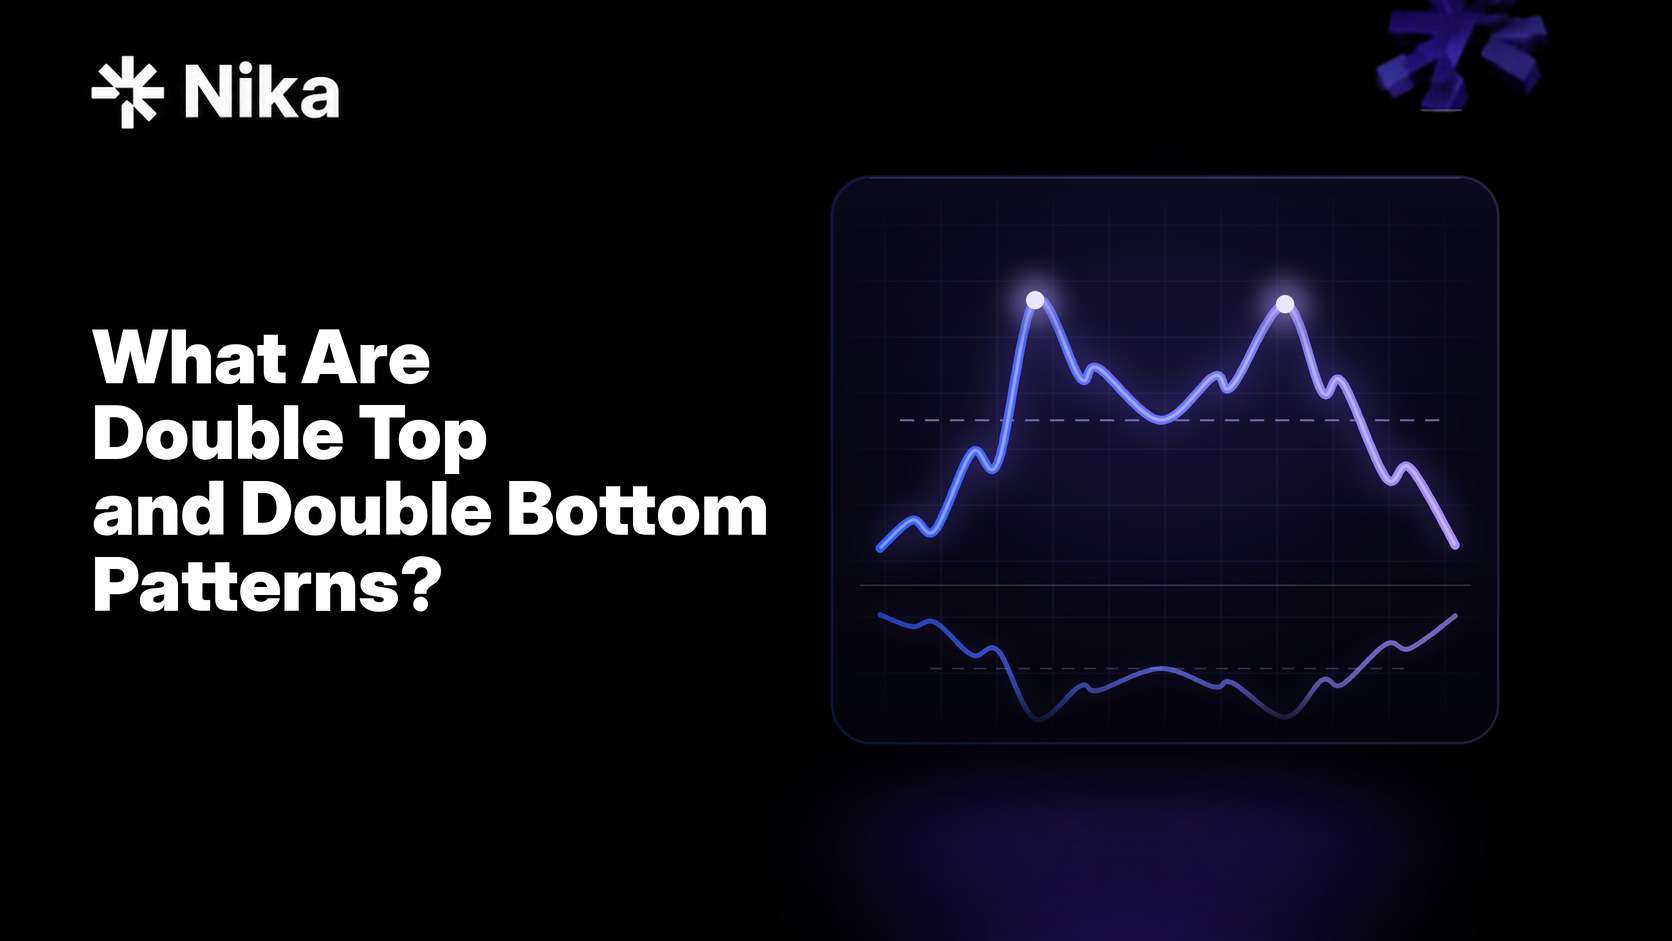
A double top pattern is a bearish reversal: price makes two peaks at about the same level after an uptrend, and the pattern completes when price breaks below the low between them. A double bottom is the bullish mirror, with two lows after a downtrend and a break above the high between them. Traders call them the M and the W because of their shape.
Like any chart pattern, both describe past price action. Neither one guarantees a reversal, and many potential double tops and bottoms never complete.
Disclosure: This guide is published by Nika, an app where you can trade crypto, stocks, commodities, and forex, including Hyperliquid perpetuals. It explains standard technical analysis and is not financial advice.
What is a double top pattern? The short answer
A double top forms when price rises to a peak, pulls back to a trough, rallies to roughly the same high, and fails again. The low of that trough is the neckline, and a close below it confirms the pattern. A double bottom is the reverse: two similar lows, confirmed by a close above the high between them.
- Double top (M): bearish, two peaks, confirmed below the neckline.
- Double bottom (W): bullish, two troughs, confirmed above the neckline.
- Target: the pattern’s height projected from the neckline, as a rough guide.
Anatomy of a double top
StockCharts ChartSchool describes the double top as two roughly equal peaks with a moderate trough between them, marking at least an intermediate-term change from an uptrend to a downtrend (StockCharts ChartSchool). The guidelines below come from that page. They are typical ranges, not fixed rules.
The prior uptrend
A reversal pattern needs a trend to reverse. ChartSchool looks for a significant uptrend of several months before the first peak.
The first peak
The first peak is the highest point of the trend so far. On its own it looks like a normal high, and nothing about the uptrend is in question yet.
The trough and the neckline
After the first peak, price usually falls 10% to 20%. The lowest point of that pullback is the neckline, the support level the whole pattern depends on.
The second peak
Price rallies back toward the first high, often on lighter volume, and meets selling there. ChartSchool says a second peak within about 3% of the first is usually close enough, and the time between peaks is often one to three months.
Volume
Volume tends to be light on the rally to the second peak and heavier on the decline that follows. A weak rally into the second peak and a heavy decline away from it are signs that buyers are losing control.
The break
The pattern is not complete until price breaks below the neckline, ideally on rising volume. Until then, the uptrend is still intact. Broken support often turns into resistance, and price sometimes rallies back to test it before falling further.
The M shape is why traders also call the double top an M pattern.
Anatomy of a double bottom pattern
The double bottom pattern is the same structure turned upside down: two roughly equal troughs with a moderate peak between them, after a downtrend (StockCharts ChartSchool).
The prior downtrend
There has to be a downtrend to reverse, again ideally lasting several months.
The first trough
The first trough is the lowest point of the decline so far, and the downtrend still looks firmly in place.
The peak and the neckline
Price usually bounces 10% to 20% from the first trough. The high of that bounce is the neckline, now a resistance level.
The second trough
Price falls back toward the first low and finds support there. ChartSchool treats a second low within about 3% of the first as valid, and prefers at least four weeks between the two lows. Bottoms usually take longer to form than tops.
Volume
Volume matters more for a double bottom than for a double top. ChartSchool looks for clear signs that volume and buying pressure are picking up on the advance from the second trough.
The break
A close above the neckline completes the pattern, ideally with expanding volume. Broken resistance can then act as support on a pullback. Because of its shape, the double bottom is often called a W pattern.
How to tell a valid pattern from a lookalike
Two similar highs or lows on a chart are common. Most of them are ordinary resistance or support, not a reversal. Check these before calling one a double top or bottom:
- A real prior trend. No trend, no reversal.
- Peaks or troughs at about the same level. ChartSchool’s guide is within about 3%.
- Enough time between them. ChartSchool suggests the peaks be about a month apart. Two highs a few days apart are more likely normal resistance.
- A meaningful trough or peak in between. ChartSchool wants the dip between two peaks to be at least 10%.
- Confirmation on the neckline break, not on the second peak or trough. ChartSchool calls waiting for the break the most important part of trading the pattern.
ChartSchool also describes simple filters against false breaks: a price filter, such as requiring a 3% break of the neckline, or a time filter, such as requiring the break to hold for three days. Filters cost you some of the move in exchange for fewer false signals.
Where traders enter, stop, and target
Plan the entry, stop, and target before you place the trade.
Entry
The classic entry is a close beyond the neckline: below it for a double top, above it for a double bottom. A second option is to wait for a retest of the broken neckline, which can give a better price and a tighter stop but misses breaks that never come back. Entering at the second peak or trough, before confirmation, gets the best price and carries the most risk, because the trend may simply continue.
Stop-loss
The common stop sits beyond the second peak for a double top, or below the second trough for a double bottom. If price gets there, the pattern has failed. A tighter stop just beyond the neckline retest cuts the loss per trade but gets hit more often. A stop is a trigger, not a guaranteed fill. In a fast move or a gap, it can fill at a worse price.
Measured-move target
The usual target is the measured move: take the height from the peak to the neckline and project it from the neckline, down for a double top and up for a double bottom (StockCharts ChartSchool). Treat it as a rough reference. Thomas Bulkowski, who publishes chart pattern statistics, writes that the full-height measure rule “doesn’t work well” and suggests scaling it down (ThePatternSite).
Worked example
The numbers below are hypothetical round numbers for a double top, for illustration only. They are not a real chart or a forecast.
| Step | Price |
|---|---|
| First peak | 100 |
| Second peak | 99.50 |
| Neckline (trough low) | 90 |
| Pattern height | 10 (100 minus 90) |
| Short entry, after a close below the neckline | 89.50 |
| Stop, above both peaks | 100.50 |
| Measured-move target | 80 (90 minus 10) |
| Risk per unit | 11 (100.50 minus 89.50) |
| Potential reward per unit | 9.50 (89.50 minus 80) |
With the stop above the peaks, the trader risks 11 to aim for 9.50, a reward-to-risk ratio of about 0.9 to 1. A tighter stop at 92.50, above a neckline retest, cuts the risk to 3 and lifts the ratio to about 3.2 to 1, but that stop is much easier to hit. Neither ratio says how likely the target is. The example excludes fees, spread, slippage, and funding on perps.
Double tops compared with other reversal patterns
Several reversal patterns share the same idea: price fails at a level more than once, then breaks the support or resistance below or above it.
| Pattern | Shape | Confirmation | Bias |
|---|---|---|---|
| Double top (M) | Two similar peaks | Close below the trough low | Bearish |
| Double bottom (W) | Two similar troughs | Close above the peak high | Bullish |
| Triple top | Three similar peaks | Close below the lows between them | Bearish |
| Head and shoulders top | Three peaks, the middle one highest | Close below the neckline | Bearish |
| Inverse head and shoulders | Three troughs, the middle one lowest | Close above the neckline | Bullish |
The difference between a double top and a head and shoulders is the middle peak. A head and shoulders has three peaks, with the middle one, the head, higher than the two shoulders (StockCharts ChartSchool). A triple top has three roughly equal highs (StockCharts ChartSchool). A double bottom also differs from the rounded base of a cup and handle, which is a continuation pattern rather than a reversal. For short pauses inside a trend, see bull and bear flags.
Why double tops and bottoms fail
The pattern fails in a few common ways.
- False breaks. Price closes through the neckline, then snaps back and runs the other way. ChartSchool’s price and time filters exist for this reason.
- The trend is still strong. In a strong uptrend, two similar highs are often a pause before the next leg up.
- Weak volume on the break. A neckline break without a pickup in volume has less conviction behind it.
- News. Earnings, central bank decisions, and macro data can override any chart pattern in a single session.
- Jumping the gun. Trading the second peak or trough as if the pattern were confirmed means acting before the break that completes it, which ChartSchool calls jumping the gun.
There is no fixed success rate for double tops or bottoms. Published statistics depend on the market, the period studied, and how the pattern and the trade were defined, and they describe history rather than predict the next break. Patterns are probabilities, not signals.
Double tops and bottoms in crypto, stocks, gold, and forex
The shape is the same everywhere, but the timing differs.
- Crypto trades 24/7, so there are no overnight gaps, but sharp wicks can briefly pierce a neckline or a stop before price recovers.
- Stocks trade in sessions, so price can gap through a neckline at the open, often after earnings. ChartSchool’s worked examples use stock charts.
- Gold and silver can form double tops and bottoms on weekly charts that take many months to develop.
- Forex pairs such as EUR/USD trade around the clock on weekdays, and patterns often form around major levels and economic releases.
Trading a double top or bottom with leverage
Chart patterns fail often, and leverage magnifies losses as well as gains.
- Size so a failed pattern is a small, fixed loss. Work out the distance from entry to stop, then size the position so that hitting the stop costs a small, fixed share of your account.
- Leverage amplifies both sides. It does not make the break more likely, and it moves your liquidation price closer to your entry. Your stop should sit well before your liquidation price. This guide explains how a liquidation price is set.
- Holding a perp means funding. A double bottom can take weeks to play out, and funding, which you may pay or receive, adds up over that time. This explains how perpetuals differ from dated futures.
Read more about the risks of trading with leverage.
Hyperliquid perps on Nika offer leverage of up to 50x, with isolated or cross margin, depending on the market. In isolated margin, a liquidation affects only that position and its margin. The Nika app shows an estimated liquidation price before you confirm a perp trade.
Frequently asked questions
Is a double top bullish or bearish?
A double top is bearish. It signals that an uptrend may be reversing, and it is confirmed only when price closes below the neckline.
How reliable is the double top pattern?
There is no fixed reliability figure. Results depend on the market, the timeframe, volume, and the broader trend, and the pattern fails often enough that a stop and careful sizing matter.
What is a W pattern in trading?
A W pattern is another name for a double bottom: two similar lows after a downtrend, with a bounce between them. It is confirmed when price closes above the high of that bounce.
How do you confirm a double bottom?
Wait for a close above the neckline, the high between the two lows, ideally on rising volume. Until that break, the downtrend is still in place.
What is the difference between a double top and a head and shoulders?
A double top has two similar peaks. A head and shoulders has three, with the middle peak higher than the other two. Both confirm on a break below the neckline.
Can I trade double top and double bottom setups on Nika?
Yes. Nika provides access to 500+ markets, including crypto, stocks, commodities, and forex, where these patterns can form, and its Hyperliquid perps let you go long or short. Spotting the pattern and deciding whether to trade it is up to you.
Sources
- StockCharts ChartSchool, Double Top Reversal
- StockCharts ChartSchool, Double Bottom Reversal
- StockCharts ChartSchool, Head and Shoulders Top
- StockCharts ChartSchool, Triple Top Reversal
- Thomas Bulkowski, ThePatternSite, Measure Rule
Sources checked on 2 November 2026.
Explore Nika
Watch for double tops and bottoms on crypto, stocks, gold, and forex charts in one non-custodial app.
Open Nika to trade spot gold, silver, oil, and EUR/USD. You can also buy fractional tokenized NVDA, AAPL, TSLA, and SPCX, or use Hyperliquid perps to go long or short, and explore 500+ markets on Nika. Gas fees are covered automatically in the Nika app. Nika is non-custodial and does not hold users’ private keys, so you, and only you, control your assets. You can get the Nika app on iPhone and Android.
Access to perpetuals and prediction markets is subject to the underlying protocols’ terms and availability.
